
When sales look healthy but you’re keeping less of each dollar, something changed between then and now. Usually it’s one of a handful of things: product cost, fulfillment, discounts, returns, ad spend, or the mix of what you sell. The fix starts with comparing a stronger month with a weaker one and tracing where the margin went.
That comparison is where SAL Accounting starts when an online supplement brand’s margin slips. Walk through it below.
Start with a number you can trust. Run your earnings through the Ecommerce EBITDA Calculator before you compare periods.
Quick Takeaways
- Compare the same margin metric across two comparable periods before looking for a cause.
- A margin bridge shows exactly where the lost percentage points went.
- Margin can fall without any cost going up, simply because you sell a different mix.
- Rising ad spend per order is an acquisition problem, not a product problem.
- A small cost on every order often matters more than one large one-time hit.
- Fix the biggest recurring driver you can actually change, then measure again.
Is Your Online Supplement Business Profit Margin Really Dropping?
Before hunting for a cause, make sure the drop is real. Many “margin drops” turn out to be a comparison problem. Check three things first:
- Same metric: Gross margin, contribution margin, and net profit margin measure different things. Compare the same one in both periods.
- Comparable periods: Compare a full quarter with a full quarter, or this October with last October. A sale month against a quiet month will mislead you.
- Clean books: An inventory count adjustment, a late co-packer invoice, or a one-time write-off can make one month look much worse than it really was.
That last point catches a lot of founders. When COGS or inventory lands in the wrong month, you’re looking at one of the bookkeeping issues that make a supplement brand’s profit look wrong, not a real change in the business. For this article, we’ll use one example throughout:
- Previous period contribution margin: 28%
- Current period contribution margin: 21%
The job is to find where those seven points went. We’re using contribution margin here because it shows what each sale keeps after the costs of making and selling it.

What Changed Between Your Brand’s Stronger and Weaker Margin Periods?
Build a margin bridge. Start with the old margin, list each change, and end at the new margin. Every point lost has to show up somewhere. Here’s the bridge for our example, using contribution margin after ad spend. The numbers are illustrative.
| Driver | Previous Period | Current Period | Margin Impact |
|---|---|---|---|
| Starting contribution margin | 28.0% | ||
| Product and manufacturing cost | 30% of sales | 32.5% of sales | −2.5 points |
| Fulfillment and selling costs | 14% of sales | 15% of sales | −1.0 point |
| Promotions and discounts | 6% of sales | 7.5% of sales | −1.5 points |
| Returns and replacements | 2% of sales | 2.5% of sales | −0.5 points |
| Advertising | 20% of sales | 22% of sales | −2.0 points |
| Sales mix | +0.5 points | ||
| Ending contribution margin | 21.0% | −7.0 points total |
Now the problem has a shape. Product cost and advertising explain most of the drop. Returns barely moved.
That’s the value of a bridge. You don’t need to investigate every expense equally. You only need to find what changed between the two periods.
Pro Tip: Show each cost as a percentage of sales in both periods. Comparing dollars alone hides the story when sales grow or shrink.
Did Ingredient, Packaging, or Co-Packer Costs Increase?
Start with the product itself. If each unit costs more to make and your price stayed the same, margin falls on every sale. Look for:
- Ingredient price increases
- Co-packer price increases
- Packaging cost increases
- Smaller production runs that raise the cost per unit
- Cost changes between one batch and the next
- Higher inbound freight, duties, or exchange-rate costs
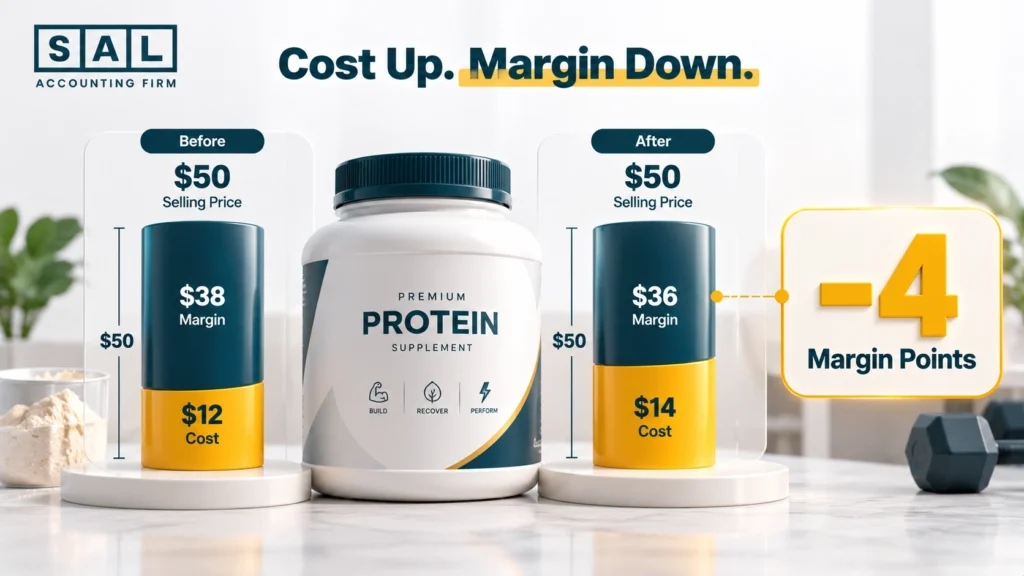
Here’s a simple example. A tub that sells for $50 used to cost $12 to make. The latest batch costs $14. That $2 increase takes 4 points of margin off every tub you sell at the same price.
Input costs can move fast. When supplier quotes start creeping up, Statistics Canada’s Raw Materials Price Index shows whether manufacturers across the country are paying more too. And if your co-packer bills in US dollars, a weaker loonie can raise your cost per unit with no price change from the supplier at all. Checking the daily exchange rates on your payment dates shows how much of the jump came from currency.
Case Study: How Noah’s Sleep Supplement Brand in Riverdale, Toronto Finds Its Missing Margin1
Noah runs an online sleep and magnesium supplement brand from a small office in Riverdale, Toronto. He sells on Shopify and Amazon. Revenue is up 15% on last year, but his contribution margin fell from 31% to 23%. His first guess is ad spend, so he’s planning to cut his Meta budget.
The Problem
Noah has never compared the two periods line by line. He doesn’t know whether ads, product costs, or something else caused the drop. Cutting ads blindly could slow sales without fixing the real problem.
What We Do
We build a margin bridge between the two periods, with every cost shown as a share of sales. Product cost explains 4 of the 8 lost points: his co-packer raised prices, and a smaller last run pushed the unit cost up further. Fulfillment explains 2 more, after his 3PL changed its pick-and-pack rates. Ads explain only 1.5 points, and the rest comes from a shift toward Amazon sales.
The Result
Noah keeps his ad budget and focuses on the biggest driver instead. He goes back to a full-size production run and negotiates with his co-packer, then reviews his 3PL contract. Within two quarters, his contribution margin is back above 28%.
Did Fulfillment, Shipping, or Selling Costs Increase for Your Online Store?
Check whether you’re spending more to complete the same sale. These costs often creep up quietly. Look at:
- 3PL pick-and-pack charges
- Outbound shipping rates
- Changes in where your customers are, and the shipping zones that come with it
- Free shipping you’re absorbing
- Amazon FBA or marketplace fees
- Payment processing fees
- A change in how orders are fulfilled
The core question: is the business spending more to fulfill the same dollar of sales than it did before?
Compare these costs per order and as a share of sales in both periods. A carrier rate change of $0.80 per order looks small on an invoice, but it costs more than a full point of margin on a $60 average order. To see what each order keeps after platform fees, try the Shopify Fee Calculator. If shipping turns out to be the culprit, it may be time to compare ecommerce shipping providers before your next contract renews.
Are Discounts, Bundles, or Free Shipping Cutting the Price You Keep?
Margin can fall even when your listed prices haven’t changed. What matters is the price you actually keep after promotions. Watch for:
- Deeper discounts
- A higher share of orders using a promo code
- Bundle discounts
- Subscription discounts
- Free gifts with purchase
- A lower free-shipping threshold
Compare your average realized price per unit in both periods, not your list price. If your $50 tub now sells for an average of $44 after promotions, you’ve lost 12% of your price before any cost has moved.
Promotions aren’t wrong in themselves. But if discounting has quietly become the default, it may be time to revisit your ecommerce pricing strategy rather than run another sale.

Have Returns, Refunds, or Damaged Orders Increased?
Some margin disappears after the sale. Check whether these costs have grown:
- Refunds
- Replacement shipments
- Reships for lost parcels
- Return shipping
- Damaged products
- Returned products you can’t resell
Supplements add a twist. Once a sealed product comes back, it often can’t be resold, so a return can cost you the product and the shipping both ways.
Compare these costs as a share of sales or orders, not as total dollars. A refund total that rises with sales isn’t a problem. A refund rate that rises is. Tightening your refund policy can bring that rate back down.
Is Advertising Taking More of Each Online Supplement Sale?
Separate a product problem from an acquisition problem. If product cost and fulfillment are steady but margin still fell, look at ads. Compare across both periods:
- Total ad spend
- Customer acquisition cost (CAC)
- Ad spend per order
- Contribution before ads
- Contribution after ads
Here’s an example. CAC rises from $18 to $27, while product cost and fulfillment stay the same. Contribution before ads hasn’t changed, but contribution after ads has dropped. The issue isn’t the product. It’s what you pay to win each customer.
Make sure the ad numbers are real first, since Meta, Shopify, and Triple Whale rarely report the same results. If a lot of your new customers are subscribers, check whether they stay long enough to make your subscriptions profitable at the higher CAC.
Did Your Online Supplement Sales Mix Change?
Your overall margin can fall even when no single cost goes up. If you’re selling more of your lower-margin products or channels, the blended margin drops.
Product Mix
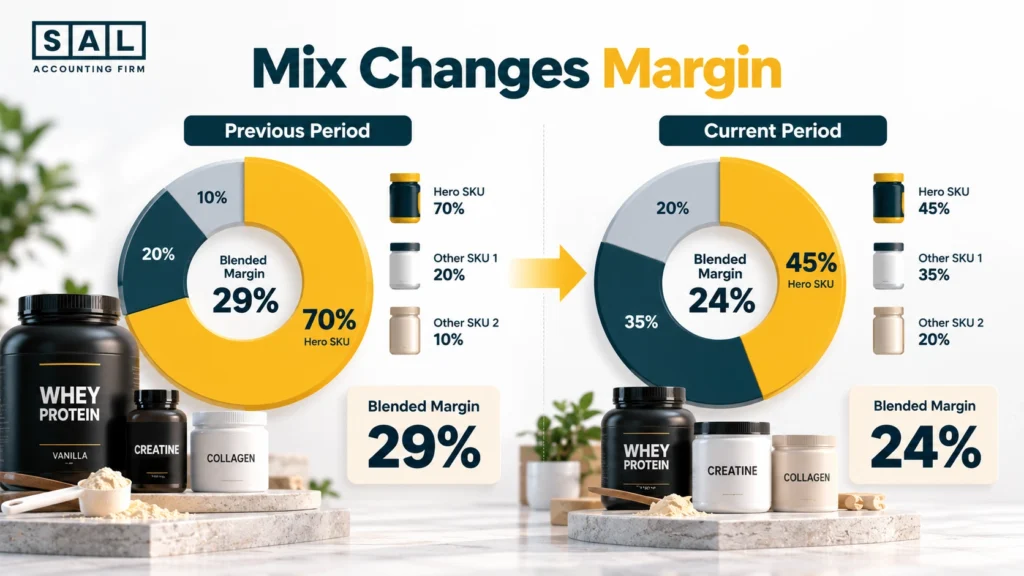
Say your hero SKU earns a 35% margin and your other products average 15%.
- Last period: the hero SKU was 70% of revenue, so the blended margin was 29%
- This period: the hero SKU is 45% of revenue, so the blended margin is 24%
Nothing got more expensive. You just sold a different mix. Knowing your profitability by SKU shows which products pull the average up and which pull it down.
Channel Mix
More sales may have moved from Shopify to Amazon, or the other way around. Each channel carries different:
- Marketplace fees
- Fulfillment costs
- Shipping costs
- Return rates
- Advertising costs
So revenue can grow while blended margin falls. Keeping each channel’s numbers separate in your books makes this easy to spot. That’s the core of multichannel accounting for supplement brands.
Subscription Mix
A bigger share of subscription orders can change your blended margin because of:
- Subscribe-and-save discounts
- First-order incentives
- Free gifts for new subscribers
- Different repeat-order economics
Case Study: How Avery’s Protein Brand in Clarkson, Mississauga Spots a Mix Shift2
Avery sells protein powder and pre-workout from a warehouse unit near Clarkson in Mississauga. Her contribution margin fell from 26% to 21% over two quarters. She checked her supplier invoices and shipping bills, and none of her costs had gone up. She can’t see where the margin went.
The Problem
Avery is looking for a cost increase that doesn’t exist. Her costs are flat. What changed is what she sells and where. A successful Amazon launch now brings in 40% of revenue, up from 15%. A new subscription offer with a 20% first-order discount has also grown fast.
What We Do
We split her margin by channel and order type for both periods. Amazon orders carry higher fees and a lower margin than her Shopify orders. First-order subscriptions carry the deepest discount. The bridge shows that mix explains almost all 5 lost points.
The Result
Avery keeps growing on Amazon, but she adjusts her Amazon pricing to cover the higher fees. She also reduces the first-order subscription discount. Her blended margin recovers to 24% while total sales keep climbing.
Is the Profit Margin Drop Temporary or Structural?
Not every drop needs a fix. Some will fade on their own. Others will keep costing you every month.
The table below shows how to tell the difference.
| Driver | Temporary Example | Structural Example | What to Do |
|---|---|---|---|
| Product cost | One expensive emergency batch | Permanent co-packer price increase | Monitor vs renegotiate or reprice |
| Ingredients | Short-term price spike | Long-term input cost rise | Wait it out vs rework pricing |
| Returns | One bad production lot | Ongoing quality issue | Fix the lot vs fix the product |
| Promotions | One Black Friday sale | Discounts in every month | Accept it vs reset discount depth |
| Advertising | One expensive test campaign | Steadily rising CAC | Pause the test vs rethink acquisition |
| Mix | One big wholesale order | Long-term shift to a lower-margin channel | Ignore vs adjust channel pricing |
Here’s the key point. A small cost that repeats on every order can matter more than a big one-time hit. A $0.50 increase on 10,000 orders a month costs far more over a year than a single $3,000 surprise.
Left alone long enough, a structural problem can push some orders into negative contribution margin, where every sale loses money.
Which Cause of the Margin Drop Should an Online Supplement Business Fix First?
Rank each driver from your margin bridge with three questions.
How Much Margin Did It Cost?
Start with the driver that explains the biggest share of the drop. In our example, product cost (2.5 points) and advertising (2 points) come first.
Will It Keep Happening?
Sort each driver into one-off, occasional, or every-order. Every-order costs come first, even when they look small.
Can You Change It?
Possible responses, each tied to a specific driver:
- Product cost: renegotiate with your co-packer or change pack size
- Price: adjust your selling price
- Promotions: reduce discount depth
- Shipping: change your free-shipping threshold
- Fulfillment: review 3PL terms or packaging
- Channel mix: price each channel to cover its own costs
- Advertising: cut campaigns that don’t pay back
Before you renegotiate, know exactly what each batch cost you. Being able to reconcile a co-packer production run line by line gives you facts to bring to the table, not just a feeling that prices went up.
The table below shows how this works for our example.
| Driver | Points Lost | Recurring? | Can You Change It? | Priority |
|---|---|---|---|---|
| Product cost | 2.5 | Every order | Yes, with supplier and pricing | 1 |
| Advertising | 2.0 | Every month | Yes, with campaign changes | 2 |
| Promotions | 1.5 | Most months | Yes, with discount rules | 3 |
| Fulfillment | 1.0 | Every order | Partly, with 3PL terms | 4 |
| Returns | 0.5 | Occasional | Partly | 5 |
Every action should connect back to a driver you’ve already measured. Don’t start with a generic list of ways to raise margin.
How Do You Know Whether the Margin Fix Worked?
Go back to the same bridge:
Previous Margin → Cause Identified → Change Made → New Margin
To judge the result fairly:
- Use the same margin metric as before
- Give the change enough time to show up, usually at least a full month or quarter
- Look at both margin percentage and margin dollars
- Don’t judge success by revenue growth alone
This check gets much easier when the same monthly financial reports land on time, in the same format, every month.
- Read more: “Profit Margin Review by an Ecommerce Accountant”

Final Thought: Where Did Your Online Supplement Brand’s Missing Margin Go?
When margin drops, don’t guess. Confirm you’re comparing the same metric across fair periods, then build a bridge from the old margin to the new one. Product cost, fulfillment, discounts, returns, ads, and sales mix will usually explain the gap.
Fix the biggest recurring driver you can change first. Then measure again with the same bridge.
Clear margins are one step toward stronger numbers. Map out what comes next with our financial roadmap for online supplement brands.