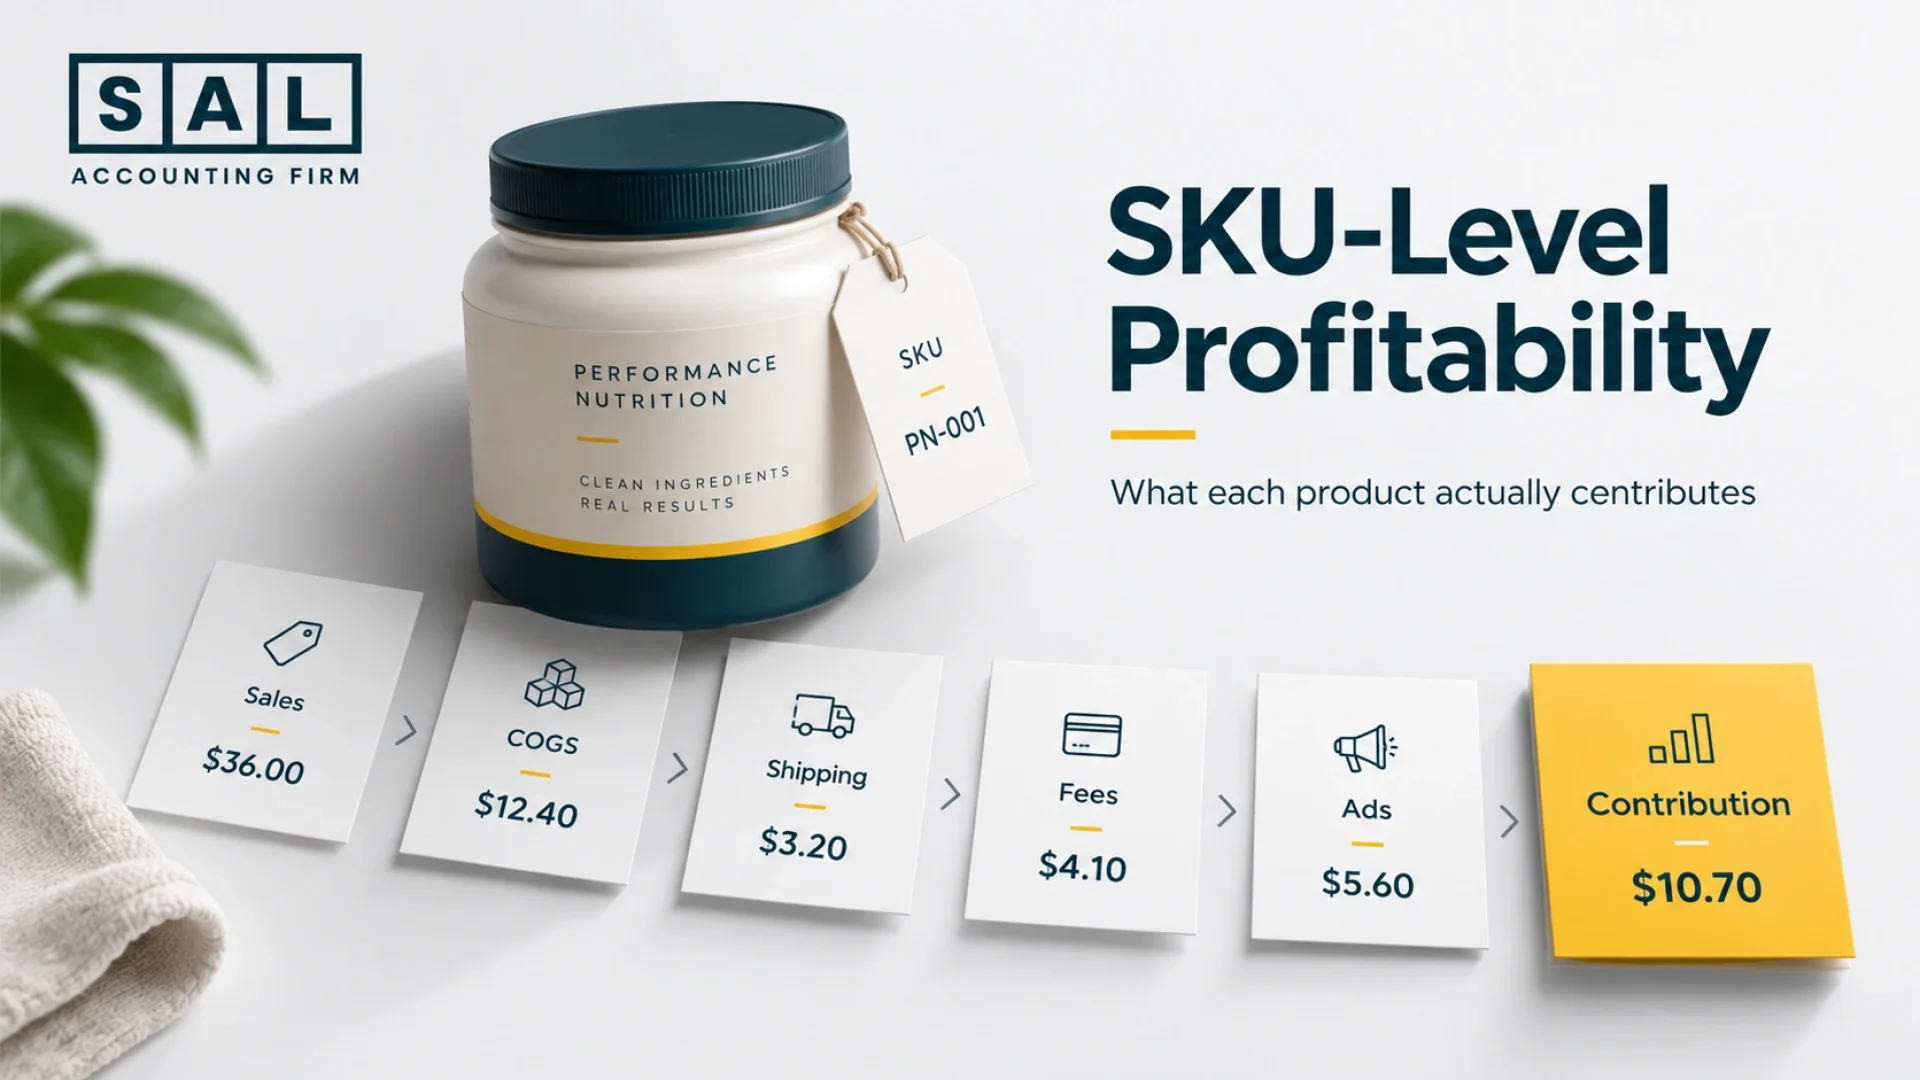
SKU-level profitability shows what each supplement actually contributes after product cost and the variable costs needed to sell it. A bestseller can look great at gross margin and still leave very little after fulfillment, shipping, fees, refunds, discounts, and advertising.
That product-level view is part of how SAL Accounting looks at ecommerce numbers. Keep reading before your next reorder. the SKU driving sales may not be the one driving profit.
Want the company-level picture first? Run the Ecommerce EBITDA Calculator, then come back to the SKU math.
Quick Takeaways
- Gross profit and SKU contribution are not the same thing.
- Start with net SKU sales and a reliable product cost.
- Include relevant fulfilment, shipping, payment, marketplace, refund, and advertising costs.
- Compare contribution per unit, contribution margin %, and total contribution dollars.
- The same SKU can perform differently on Shopify, Amazon, subscriptions, and bundles.
- Shared costs do not need perfect allocation. They need a reasonable method used consistently.
What Does SKU-Level Profitability Measure?
SKU-level profitability shows how much an individual product leaves after the costs connected to selling it. There are three numbers you need to keep separate.
| Profitability Layer | Simple Formula | Includes | Does Not Include | What It Tells You |
|---|---|---|---|---|
| Gross profit | Net sales − COGS | Product cost | Selling + fixed costs | Margin after product cost |
| SKU contribution | Net sales − COGS − variable selling costs | Product + selling costs | General fixed overhead | What the SKU contributes |
| Contribution margin % | Contribution ÷ net sales | Same variable costs | Fixed overhead | % of revenue remaining |
| Overall business profit | Total contribution − broader costs | Whole business | — | What the company earns |
For product comparison, SKU contribution is usually the most useful layer.
Let’s say a supplement sells for $60 and COGS is $18. Gross profit is $42. Sounds healthy.
But you still haven’t accounted for fulfilment, shipping, payment fees, refunds, or advertising.
That distinction is important across online supplement business accounting. Product sales alone do not tell you what the product actually leaves behind.
The point is simple: gross margin stops at product cost. SKU contribution goes further.
What Numbers Do You Need to Calculate Profitability for Each SKU?
You don’t need dozens of inputs. You need the right ones.
Net SKU Sales
Use revenue attributable to the SKU after relevant discounts, refunds, and adjustments. Don’t start with the payout hitting the bank. Sales and payouts are different numbers, which is why reconciling supplement revenue against ecommerce payouts should happen separately.
Units Sold
Use actual units sold during the period. Don’t use units purchased, manufactured, or currently sitting in inventory.
Product Cost
Use a reliable COGS or landed product-cost figure. We assume that number already exists. If it doesn’t, deal with the underlying inventory and landed cost calculation first.
Variable Selling Costs
Depending on the SKU, these may include:
- fulfilment;
- outbound shipping absorbed by the business;
- payment or marketplace fees;
- refunds and returns; and
- attributable advertising.
Pro tip: Don’t make the model more complicated than your data can support. A consistent estimate is more useful than pretending an allocation is exact when it isn’t.
How Do You Calculate SKU-Level Profitability?
Use this formula:
SKU Contribution = Net SKU Sales − COGS − Relevant Variable Selling Costs
Here’s a simple supplement example.
| Line | Amount Per Unit | Type | Amount Remaining | Why It Is Included |
|---|---|---|---|---|
| Net SKU sales | $60 | Revenue | $60 | Starting point |
| Landed COGS | ($18) | Product cost | $42 | Cost of product sold |
| Fulfilment | ($4) | Variable cost | $38 | Pick-and-pack |
| Outbound shipping | ($6) | Variable cost | $32 | Delivery absorbed |
| Payment fees | ($2) | Variable cost | $30 | Transaction cost |
| Return allowance | ($3) | Variable cost | $27 | Post-sale losses |
| Advertising | ($12) | Variable cost | $15 | Attributable acquisition cost |
| SKU contribution | $15 | Result | $15 | Left before fixed overhead |
So:
$60 − $18 − $4 − $6 − $2 − $3 − $12 = $15
Now calculate contribution margin:
$15 ÷ $60 = 25%
That gives you:
- Contribution per unit: $15
- Contribution margin: 25%
This is not net profit. Salaries, software, office costs, and other broader expenses still need to be covered.
Our ecommerce SKU profitability analysis guide goes deeper into what a useful product-level profitability report should show.

Case Study: How a Supplement Brand in Liberty Village Finds the Real Profit on Its Bestseller1
A supplement brand in Liberty Village, Toronto sells a magnesium product for $60 per bottle. It costs $18 per unit, so the owner sees $42 of gross profit and assumes it is one of the strongest products in the store. It also sells more units than most of the catalogue, which makes that assumption feel even safer.
The Problem
The $42 gross profit only includes product cost. Once the brand adds $4 of fulfilment, $6 of outbound shipping, $2 of payment fees, $3 for refunds and returns, and $12 of attributable advertising, the picture changes.
The calculation becomes:
$60 sales − $18 COGS − $4 fulfilment − $6 shipping − $2 fees − $3 returns − $12 advertising = $15 contribution per unit
Instead of looking at a $42 gross profit, the owner can now see that each sale contributes $15 before fixed business costs.
What We Do
We separate gross profit from SKU contribution and track the same cost lines each month. We also compare the magnesium SKU with other products using three numbers: contribution per unit, contribution margin %, and total contribution dollars.
That stops the team from ranking products based only on revenue or gross margin.
Result
The bestseller is still profitable, but the owner now understands why a product with a 70% gross margin does not leave 70% of the sale available to the business.
More importantly, the team can compare it properly against a lower-revenue SKU that may have cheaper shipping, less advertising spend, and a stronger contribution margin.
Don’t stop at Sales − COGS. A strong gross margin can shrink quickly once the cost of actually selling the product is included.
Why Can Two Supplement SKUs With the Same Gross Margin Have Different Profitability?
Because two products can cost the same to make and cost very different amounts to sell.
Imagine two SKUs both have a 60% gross margin. SKU A has:
- light packaging;
- low fulfilment;
- little discounting; and
- efficient advertising.
SKU B has:
- heavier packaging;
- higher shipping;
- frequent promotions; and
- more expensive customer acquisition.
Same gross margin. Different contribution margin.
Payment costs alone can change the economics of an order, which is why Shopify fees and ecommerce profit margin belong below gross profit when you’re looking at contribution.
And when those selling costs exceed what the order leaves behind, you can end up with a negative ecommerce contribution margin even while revenue is growing.

How Should You Allocate Costs That Do Not Belong to One SKU?
This is where SKU analysis gets less tidy. One shipping charge may cover three products. One payment fee may apply to an entire order. One campaign may promote several SKUs. You still need those costs in the analysis. Just use a consistent allocation method.
| Shared Cost | Possible Allocation | Works Well When | Watch Out For | Main Goal |
|---|---|---|---|---|
| Shipping | Weight, units, parcel space | SKUs differ in size | Equal split may distort cost | Reflect shipping driver |
| Order fulfilment | Units or item count | Multi-SKU orders | Separate per-item fees first | Avoid loading one SKU |
| Payment fees | Net sales value | Fee follows order value | Fixed fees may differ | Match transaction cost |
| Advertising | Direct attribution or agreed share | Campaign covers several SKUs | Attribution isn’t perfect | Stay consistent |
| Discounts | Relative selling value | Order/bundle discount | Don’t charge one SKU fully | Allocate fairly |
Pro tip: Document the rule. If shipping is allocated by weight this month, don’t suddenly allocate it by revenue next month because one method gives you a nicer margin.
Your books also need those cost types separated properly. A sensible chart of accounts for a supplement ecommerce business keeps product costs, fulfilment, outbound shipping, fees, and overhead from becoming one big expense bucket.
Can the Same SKU Have Different Profitability on Shopify and Amazon?
Absolutely. The bottle may be identical. The selling economics are not. A useful view might be:
SKU Overall
SKU × Shopify
SKU × Amazon
SKU × Subscription
SKU × Bundle
Shopify’s profit reports can show net sales, product cost, gross margin, and gross profit by product or variant when cost information has been recorded. That is useful, but it is still a gross-profit view rather than your full contribution calculation.
Amazon separately charges selling fees and, where FBA is used, fulfilment and other FBA costs. Those differences can change what the same SKU contributes.
This is why multichannel supplement ecommerce accounting needs to keep each sales channel identifiable instead of blending everything together.
Need your Shopify sales, payouts, fees, and inventory tied together properly? See SAL’s Shopify Accounting.

How Should Bundles and Multi-Packs Affect SKU Profitability?
Suppose you sell a wellness bundle containing:
- magnesium;
- vitamin D; and
- omega-3.
The individual products normally total $105, but the bundle sells for $90.
That $15 discount has to go somewhere. You need a consistent way to allocate:
- bundle revenue;
- the bundle discount;
- each component’s product cost; and
- fulfilment and shipping.
The goal isn’t to build a complicated bundle model. It’s to make sure every component isn’t being credited with full-price revenue when the customer never paid full price.
Bundles are one of several reasons a supplement brand’s reported profit can look wrong even when the underlying sales report looks fine.
How Do Subscriptions Change SKU Profitability?
The same bottle can produce a different contribution when sold as:
One-Time Purchase
versus
Subscribe-and-Save
Why?
The subscription may carry a recurring discount, different shipping behaviour, different payment fees, or a different treatment of attributable acquisition spend.
So it may make sense to compare:
SKU — One-Time
SKU — Subscription
That’s all we’re trying to answer here.
Retention, churn, LTV, and CAC payback belong in the wider subscription analysis. Our guide to subscription accounting for online supplement brands covers the broader recurring-order accounting.
Case Study: How a Supplement Brand in Port Credit Finds Three Different Margins on the Same SKU2
A supplement brand in Port Credit, Mississauga sells the same collagen powder three ways: as a one-time Shopify order, through Shopify Subscribe-and-Save, and on Amazon. The product cost is $20 in each case, so the owner has been using one blended profitability number for the SKU.
The Problem
The product is the same, but the selling economics are not. For illustration:
- Shopify one-time: $65 net sales and $19 contribution
- Shopify subscription: $58.50 after the subscription discount and $17 contribution
- Amazon: $62 net sales and $11 contribution after marketplace and fulfilment costs
When all three are blended together, the owner can see whether the SKU is profitable overall but cannot see where the product is performing well or where costs are eating into the margin.
What We Do
We keep one overall SKU view, then break it into:
Collagen — Shopify One-Time
Collagen — Shopify Subscription
Collagen — Amazon
For each one, we use the same contribution logic: net sales minus product cost and the relevant variable selling costs.
We are not comparing Shopify and Amazon as entire businesses. We are asking a narrower question: how does this exact SKU perform when sold in each context?
Result
The owner can now see that the Amazon sale generates fewer contribution dollars even though the same collagen powder is being sold.
The subscription also has a lower selling price, but that does not automatically make it a bad offer. It simply needs to be measured separately instead of disappearing inside one blended SKU margin.
How Do Samples, Expiry, and Unsellable Inventory Affect SKU Profitability?
A SKU can look healthy on every normal customer sale and still produce weak economics over the quarter.
Why?
Not every unit gets sold. Units may be:
- given away as samples;
- sent to influencers;
- damaged;
- lost;
- expired; or
- otherwise unsellable.
This is where it helps to separate two views:
Per-Sale Contribution: What does one normal sale contribute?
Period SKU Economics: What did the SKU contribute during the month or quarter after SKU-specific losses?
Don’t mix those two questions.
Samples and expiry should also show up in the monthly inventory review. A proper supplement ecommerce month-end close keeps these movements from disappearing.
When lots, expiry dates, locations, and costs become difficult to manage manually, the right inventory software for a supplement ecommerce business also makes the source data easier to trust.
Which SKU Profitability Numbers Should You Compare?
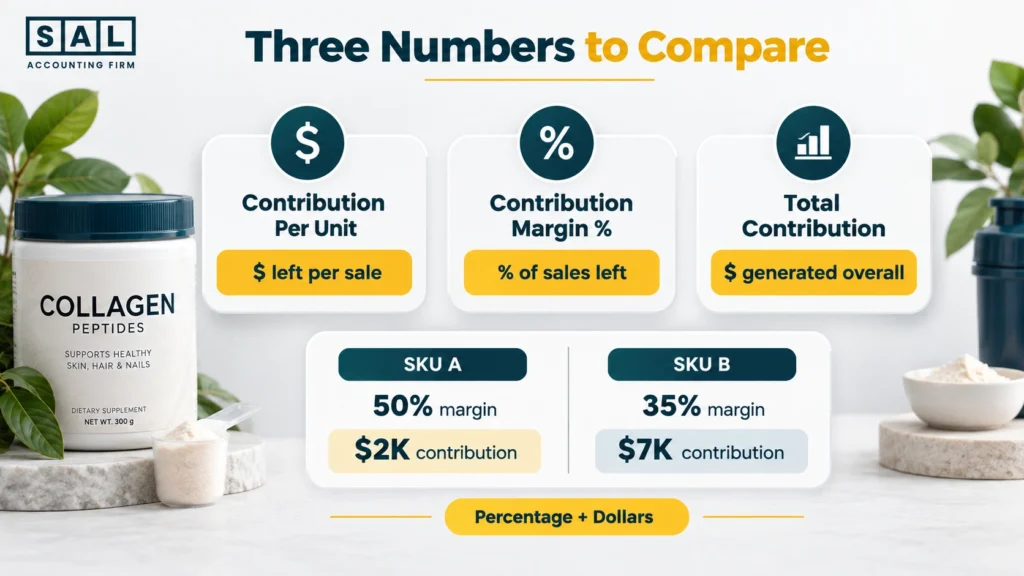
Don’t judge a product from one percentage. Look at three numbers:
Contribution Per Unit
How many dollars does one additional comparable sale contribute after product cost and the relevant variable selling costs are included? This helps you see the dollar value each sale is adding before fixed overhead.
Contribution Margin %
What percentage of net revenue remains after those variable costs are deducted? This makes it easier to compare SKUs with different selling prices and see which products keep more of each sales dollar.
Total SKU Contribution
How many contribution dollars did the SKU actually generate during the period?
For example:
SKU A generates a 50% contribution margin but only $2,000 of total contribution.
SKU B generates a 35% contribution margin but $7,000 of total contribution because it sells at much higher volume.
Neither metric is wrong. They answer different questions.
That is why product-level reporting should sit alongside the other financial reports an online supplement business reviews each month.
Pro tip: Compare percentage and dollars. A great percentage on very little volume can be misleading.
Which Costs Are Dragging Down a Low-Profit Supplement SKU?
Once a SKU looks weak, don’t immediately assume the product itself is the problem. Move down the calculation. Check:
- Product cost: Has manufacturing, packaging, freight, or another product cost increased?
- Discounting: Is the SKU regularly sold below full price?
- Fulfilment: Does it require expensive handling or packaging?
- Shipping: Is size or weight making delivery expensive?
- Advertising: Does this SKU require more paid spend to sell?
- Inventory losses: Are samples, expiry, or damage weakening period economics?
The question at this stage is:
What line is causing the problem?
Not:
Should we discontinue the SKU?
Once you’ve diagnosed the problem, the separate Keep, Fix, or Cut product profitability framework deals with what to do next.

How Do You Track SKU-Level Profitability Every Month?
Keep the process repeatable. A simple monthly flow is:
SKU → Sales → Product Cost → Selling Costs → Adjustments → Contribution
Each month, check that:
- SKU IDs are consistent across systems;
- discounts and refunds hit the right products;
- product costs are current;
- allocation methods haven’t changed without a reason;
- samples and losses are captured;
- SKU totals reasonably tie back to company-level numbers; and
- everyone is using the same profitability definition.
Software can automate parts of this. It cannot decide what your contribution metric should include.
For growing ecommerce businesses, our Ecommerce Accounting keeps sales, inventory, fees, payouts, and product costs in a consistent monthly process.
When Should You Recalculate SKU Profitability?
Monthly is a useful baseline. But recalculate sooner when something meaningful changes, such as:
- manufacturing or ingredient cost;
- packaging;
- freight or duties;
- 3PL pricing;
- selling price;
- subscription discount;
- bundle structure;
- marketplace fees;
- advertising costs; or
- expiry and write-offs.
Basically, if the amount you earn from the SKU or the cost of selling it changes materially, don’t keep using an old contribution number.
Know What Each Supplement SKU Actually Contributes
SKU profitability doesn’t need to become another huge reporting exercise.
Start with net sales. Subtract reliable product cost. Add the variable costs tied to selling the SKU. Then compare contribution per unit, contribution margin %, and total contribution dollars.
Do that consistently and you stop assuming your bestseller is automatically your best product.
For the bigger financial picture as your ecommerce business grows, get our Financial Growth Blueprint for Canadian Brands.