

Meta Ads, Shopify, and Triple Whale numbers rarely match because they measure different parts of the same sale. Shopify records store activity, Meta measures advertising outcomes, and Triple Whale assigns marketing credit using attribution rules.
For Canadian ecommerce founders, SAL Accounting focuses on what sits underneath those dashboards: sales, refunds, fees, payouts, and actual profit. Read this before your next ad-spend increase, because the biggest dashboard number may be the worst one to scale from.
Want a quick fee reality check? Run your store through the Shopify Fee Calculator. The calculator is built specifically around Shopify costs for Canadian ecommerce sellers.
Quick Takeaways: Why Ecommerce Reporting Numbers Don’t Match
- Shopify records what happens inside your store.
- Meta Ads measures results connected to your advertising.
- Triple Whale assigns marketing credit based on the attribution setup you’re viewing.
- Refunds, discounts, fees, taxes, currencies, timing, and order edits can widen the gap.
- A payout is not the same as revenue, and revenue is not the same as profit.
- The goal isn’t to make every dashboard identical. It’s to know which number belongs to which decision.
Ready for Shopify sales, refunds, fees, and payouts to land in the right place each month? Shopify accounting and bookkeeping services put the store data back into a usable financial picture.
Why Do Meta Ads, Shopify, and Triple Whale Report Different Revenue?
Because each platform has a different job.
Shopify reports store activity. Meta’s Conversions API sends marketing data into Meta’s systems for advertising optimization, measurement, and attribution. Triple Whale then has its own attribution models for deciding which marketing touchpoints receive credit. Here’s the simplest comparison:
| Source | Main Question | Best Used For | Don’t Treat It As |
|---|---|---|---|
| Shopify | What did we sell? | Store performance | Final profit |
| Meta Ads | What did Meta influence? | Campaign decisions | Booked revenue |
| Triple Whale | Who gets marketing credit? | Attribution | Accounting books |
| Accounting | What happened financially? | Profit and reporting | Ad attribution |
Triple Whale itself warns that some attribution models can assign duplicated credit across platforms and shouldn’t be used for total revenue or financial reporting.
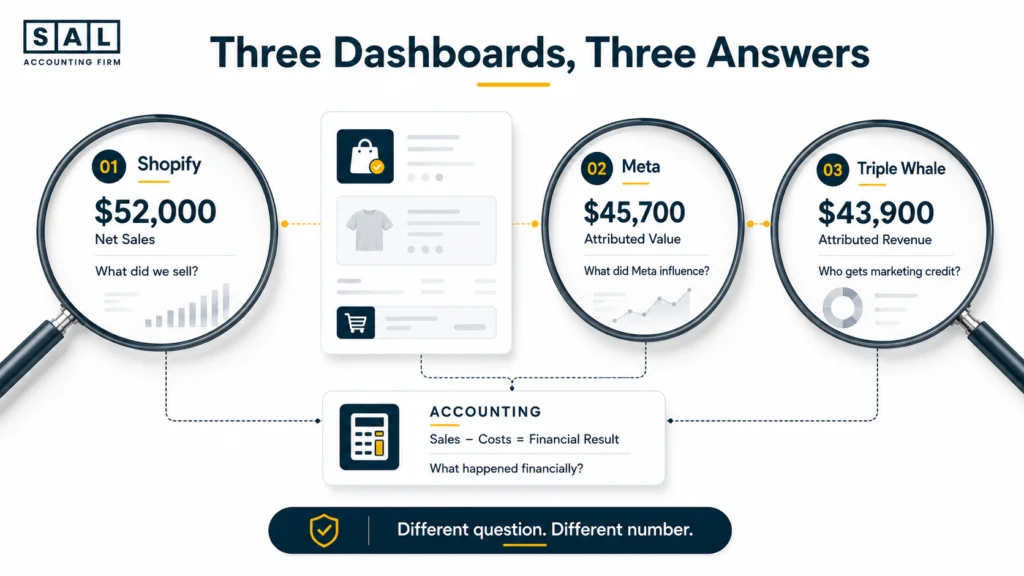
Basically, the dashboards aren’t necessarily disagreeing. They’re answering different questions.
That separation between marketing data and actual financial performance is also the reason ecommerce management reporting needs more than whichever revenue number happens to be highest.
How Can Timing Make Shopify and Triple Whale Numbers Different?
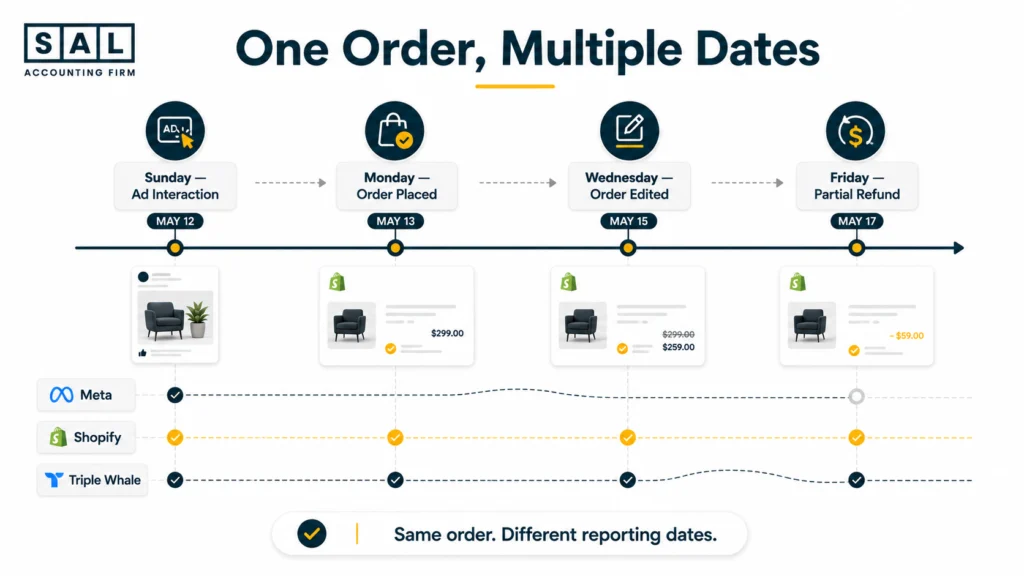
One order can touch several dates. Picture this:
- Sunday: A customer interacts with an ad.
- Monday: They buy.
- Wednesday: They edit the order.
- Friday: They receive a partial refund.
Shopify can record later changes when they occur, while Triple Whale may update some order-based values against the original processed date. That makes daily and weekly reports especially easy to misread. Before investigating the gap, check:
- date range
- timezone
- order edits
- refund timing
- attribution settings
Pro Tip: Compare a full month before worrying about a small one-day discrepancy. Triple Whale notes that order-edit differences often become less noticeable over longer periods, although exact alignment still depends on the metric and data source.
What’s the Difference Between Shopify Gross Sales, Net Sales, and Attributed Revenue?
Even Shopify doesn’t give you just one sales number. Its Finance reports distinguish gross sales, discounts, returns, net sales, shipping, taxes, and total sales. Net sales are gross sales minus discounts and returns. Imagine a Canadian skincare brand runs a weekend launch:
- Product sales before adjustments: $27,400
- Discounts: $2,150
- Returns: $1,300
- Net product sales: $23,950
Meta might attribute $21,800 to its ads.
Triple Whale might give Meta a different amount under the selected attribution model.
Then the bank receives another number after payment activity and payout timing.
The mistake is calling every one of those figures “revenue” without defining what you mean.
Once those numbers are mixed together, Shopify profit calculation mistakes become much easier to make. The same applies when ecommerce contribution margin is calculated from a marketing revenue figure instead of the right financial starting point.
- Read more: “Hidden Shopify Costs That Quietly Hurt Your Margins”
Case Study: How a Toronto Shopify Brand Found the Problem Behind a Strong Meta ROAS1
Rina runs a skincare brand in The Junction, Toronto. Meta shows $96,000 in attributed revenue, while Shopify shows $82,400 in net sales. Meta ROAS looks strong, so her team wants to increase ad spend.
The Problem
The difference comes from more than tracking. Shopify includes $5,200 in discounts and $4,100 in refunds, while Meta is giving ads credit based on attribution. The team is also treating Meta’s purchase value like actual business revenue.
What We Do
We separate the reports. Meta stays focused on campaign performance, while Shopify sales, refunds, fees, COGS, fulfilment, and ad spend are used to judge the financial result.
Result
Rina finds that her highest-ROAS campaign is pushing lower-margin discounted products. Instead of automatically scaling it, she shifts budget toward campaigns that leave more money after costs.
How Do Discounts, Refunds, and Chargebacks Change Ecommerce Reporting?
These adjustments happen at different points in the order lifecycle, so they can quickly separate one dashboard from another.
Discounts Reduce What the Store Actually Sells For
Say full-price products worth $15,500 leave the store during a promotion, but customers receive $1,700 in discounts. Gross sales and net sales are already different before refunds or fees enter the picture. That’s why categorizing Shopify transactions correctly is more useful than dropping the whole payout into one revenue account.
Refunds Can Land in Another Period
Shopify records returns as negative sales activity when they’re processed in its Finance reports. Triple Whale’s treatment depends on the data source. Its Orders table ties order-level refund values to the original order date, while its Refunds table uses the date the refund was processed.
Pro Tip: A month-end revenue drop may be a refund-timing issue rather than a sudden advertising problem.
Chargebacks Change the Cash Story Again
Shopify’s payout reconciliation report separately tracks disputes, chargebacks, dispute fees, refunds, holds, and other adjustments. So one customer can create:
Sale → attributed conversion → refund or chargeback → lower payout
That’s also why ecommerce payment reconciliation needs to follow the transaction beyond the original order.

Why Don’t Shopify Sales Match Shopify Payments or Bank Deposits?
A Shopify sale and a Shopify payout are two different events. Shopify’s payout reconciliation report includes transactions, fees, refunds, disputes, reserves, adjustments, and payouts. Shopify explicitly says the report isn’t an accounting revenue statement. So if customers spend $42,000, don’t expect exactly $42,000 to appear in your bank. The gap may include:
- payment-processing fees
- refunds
- chargebacks
- reserves
- adjustments
- payout timing
The broader problem appears when those deposits are recorded as sales. Your books may look clean while the real sales-to-bank trail is missing.
That gap is at the centre of ecommerce reconciliation best practices, especially when Shopify and multiple gateways are feeding the same accounting file.

How Do Taxes and Currency Affect Meta Ads vs Shopify Revenue?
For Canadian brands, these two issues can quietly create another reporting gap.
GST/HST Can Sit Inside the Number You’re Comparing
Shopify’s total sales calculation can include taxes, while net sales do not. For Canadian GST/HST registrants, the CRA separately requires GST/HST collected or collectible to be reported as part of the net tax calculation.
So a tax-inclusive Shopify total shouldn’t automatically be compared with another platform’s revenue metric. The accounting side becomes easier to follow when GST/HST for ecommerce stores is kept separate from product revenue.
Want a quick estimate before the next filing period? Check your GST/HST position for your ecommerce store.
CAD and USD Can Distort the Comparison
A Canadian Shopify seller might have:
- store reporting in CAD
- Meta spend in USD
- U.S. orders in USD
- payouts in more than one currency
- financial statements ultimately prepared in CAD
Shopify’s payout reconciliation report requires you to choose the payout currency being reconciled when multiple payout currencies are used.
Comparing CAD revenue against USD ad spend without normalizing the currency can make performance look better or worse for no operating reason.
Pro Tip: Put the currency beside every major KPI on your reporting sheet. “$50,000 revenue” isn’t specific enough once you sell on both sides of the border.
The same issue shows up in cross-border ecommerce cash flow because sales, tax, processor deductions, and deposits don’t necessarily move in the same currency or at the same time.
Case Study: How a Mississauga Shopify Brand Explained a $17,000 Reporting Gap2
Noah runs a Shopify home-accessories store in Streetsville, Mississauga. Shopify shows about CAD $148,000, Triple Whale shows $139,500, and bank deposits total roughly $131,000.
The Problem
There isn’t one missing $17,000. The gap includes USD sales, refunds, payment fees, month-end payout timing, tax, and Triple Whale attribution.
What We Do
We separate Shopify store activity, Triple Whale attribution, and Shopify Payments cash movement, then compare everything in one reporting currency.
Result
Noah can finally explain where the differences come from. He also sees that growing U.S. sales are carrying higher currency, payment, and shipping costs than the top-line revenue suggested.
For Canadian stores reaching this stage, a U.S. expansion setup for ecommerce brands is much easier to manage when currency, sales tax, and reporting rules are decided before volume really takes off.

How Do You Reconcile Meta Ads, Shopify, and Triple Whale Data?
Don’t begin with: “Which dashboard is wrong?”
Start with: “Am I actually comparing the same thing?”
Use this compact check before trusting the gap:
| Check | Shopify | Meta / Triple Whale | What to Confirm |
|---|---|---|---|
| Date | Order/report date | Attribution/report range | Same period |
| Revenue | Gross, net, total | Attributed revenue | Same definition |
| Refunds | Return timing | Model/data dependent | Same treatment |
| Currency | Store/payout currency | Ad/report currency | One currency |
| Tax & fees | Report dependent | Often separate | Included or excluded |
| Tracking | Store orders | Pixel/CAPI/integrations | No missing data |
Triple Whale says Shopify differences can come from date basis, refunds, cancellations, unattributed orders, pixel matching, timezone, and dashboard filters. A clean reconciliation should answer four questions:
- What did customers buy?
- What was refunded or adjusted?
- What actually moved through the payment processor?
- What did the business keep after costs?
When those answers aren’t clear, ecommerce bookkeeping in Toronto is the more relevant next step than adding another analytics dashboard.
The monthly workflow itself should also follow a consistent ecommerce bookkeeping checklist so the same reports are checked in the same order every month.
- Also read: “Ecommerce Bookkeeping Checklist for Store Owners”
Example: How One Shopify Month Creates Three Different Revenue Numbers
Let’s put the pieces together. A Canadian Shopify brand finishes the month with:
- Gross product sales: $58,000
- Discounts: $3,600
- Returns: $2,400
- Simplified net product sales: $52,000
- Meta-attributed purchase value: $45,700
- Triple Whale revenue attributed to Meta: $43,900
Which number is right?
Potentially all three.
The more important question comes next.
The store also spends:
- $17,000 on COGS
- $11,500 on Meta ads
- $1,450 on payment fees
- $4,200 on fulfilment and shipping support
That leaves roughly $17,850 from the simplified $52,000 net-sales figure before other operating expenses.
Suddenly, a $1,800 Meta vs Triple Whale difference isn’t the biggest financial question.
The bigger one is:
Did the $11,500 ad spend produce enough money after everything required to generate and fulfil those orders?
That’s why hidden ecommerce expenses and ecommerce profit versus cash flow belong in the same conversation as ROAS.
Take the dashboard one step further: calculate your Ecommerce EBITDA using revenue, COGS, marketing spend, and operating expenses.
Which Number Should You Use for Revenue, ROAS, and Profit?
There isn’t one dashboard that should answer every ecommerce question. Choose the source based on the decision you’re making:
| Business Question | Start With | Cross-Check | Best For |
|---|---|---|---|
| What did we sell? | Shopify | Accounting | Store sales |
| Which Meta ads worked? | Meta Ads | Triple Whale | Campaign decisions |
| Which channels get credit? | Triple Whale | Native platforms | Attribution |
| What reached the bank? | Payout report | Bank/accounting | Cash movement |
| What did we actually earn? | Accounting | Shopify + costs | Profit decisions |
Triple Whale specifically says its Triple Attribution model can produce revenue above actual sales because platforms may each receive full credit, which is why it isn’t recommended for financial reporting or total revenue analysis.
So keep the jobs separate:
Shopify: What happened in the store?
Meta: How is Meta advertising performing?
Triple Whale: How should marketing credit be interpreted?
Accounting: What happened financially?
A Canadian Shopify profit framework becomes much more useful once those four questions stop sharing the same “revenue” number.
And if the store looks profitable on screen but the bank account tells another story, Shopify cash flow warning signs are worth checking before increasing spend.
What Should You Do When the Numbers Still Don’t Match?
A mismatch isn’t automatically a problem. A mismatch you can’t explain is. You should be able to trace the journey from:
sale → discount → refund → tax → fee → attribution → payout → financial result
When that trail works, you don’t need Meta Ads, Shopify, and Triple Whale to display the same number.
You know what each number means. You know what changed. And you know which one belongs in the decision you’re making.
For the next stage, get the Financial Growth Blueprint for Canadian Shopify Brands and map the financial checkpoints your store should have in place as sales, ad spend, and cross-border complexity grow.