
Your sales are up. Orders are coming in. But somehow, your profit margin has barely moved—or it is getting worse. Usually, the problem is not one giant expense. It is a few dollars disappearing at different points between the sale and what you actually keep.
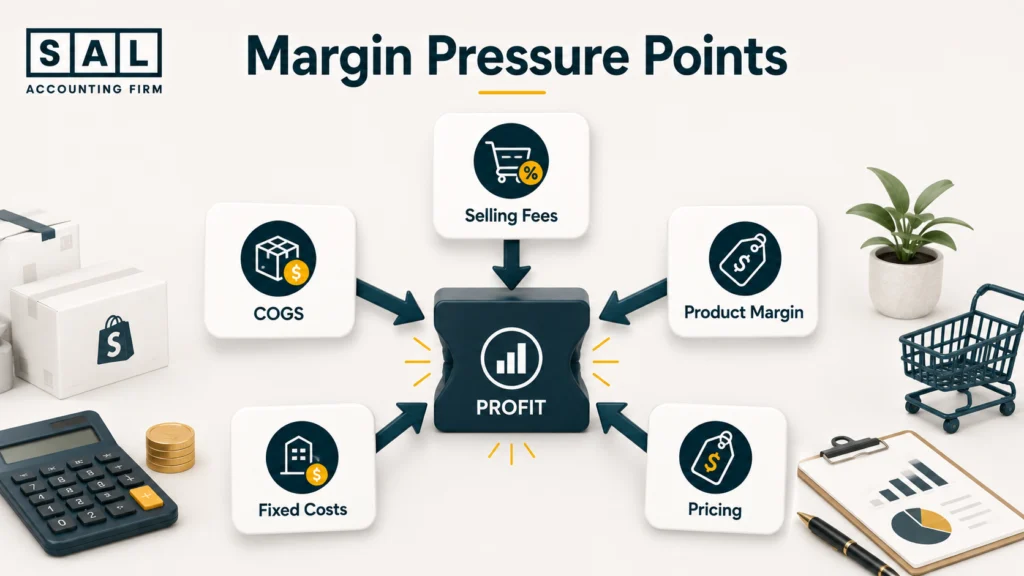
At SAL Accounting, that is where we start: COGS, fees, ad spend, product-level profit, overhead, and pricing. The number dragging your margin down is usually there somewhere.
Want a quick baseline first? Calculate your ecommerce EBITDA and see what is left after the business actually runs.
Quick Takeaways
- COGS should be checked before making decisions from the reported gross margin.
- Freight, duties, fulfilment, platform fees, returns, and advertising can quietly reduce profit per order.
- Blended margins can hide SKUs that are barely profitable or losing money.
- Growing overhead can absorb the extra gross profit created by higher sales.
- Discounts can reduce profit much faster than they reduce revenue.
- A margin problem may actually be a bookkeeping problem if the underlying numbers cannot be trusted.
When the numbers behind margin are still scattered across payouts, inventory reports, and spreadsheets, ecommerce accounting built around product costs and profitability gives the business a much clearer starting point.
Why “More Sales” Doesn’t Always Mean More Profit
Revenue tells you how much customers bought. Margin tells you how much the business kept after the costs behind those sales.
A product may still sell for $100 while supplier costs, freight, fulfilment, payment fees, returns, and advertising have all increased. None of those changes needs to be dramatic on its own; several small increases can be enough to keep margin flat while revenue keeps climbing. So when profit margins refuse to improve, the useful question is:
Which part of the margin changed?
That is where the review starts.
The First Place an Ecommerce Accountant Checks: Your Real COGS
If COGS is incomplete, the reported gross margin can look healthier than the business really is. Product cost is therefore one of the first numbers worth testing.
Landed Costs That Aren’t Making It Into COGS
A supplier might charge $30 for a product, but that does not necessarily mean the product costs the business $30. Before it is ready to sell, there may also be:
- Freight
- Duties
- Brokerage
- Inbound shipping
- Other inventory-related costs
Once those costs are included, the real unit cost might be $37 or $40. If the margin report still uses $30, the product looks more profitable than it actually is.
That is why landed cost accounting matters when margins are being reviewed. The supplier invoice alone may not capture the full cost sitting behind each sale.
Inventory Valuation Method Skewing Your Numbers
The same SKU may also cost different amounts across purchase orders. A product bought for $8 earlier in the year could cost $10 or $12 today, so the method used to value inventory affects when those changing costs appear in COGS.
The CRA has inventory valuation rules governing how inventory is valued for tax purposes. For margin analysis, the simpler question is whether the cost sitting in the report can actually be explained and reproduced.
SKUs That Are Quietly Losing Money
A company-wide gross margin can hide very different product economics. One SKU may have plenty of room while another is being squeezed by higher product costs, fulfilment, returns, or discounting.
That is where SKU profitability analysis becomes more useful than looking at one blended percentage for the whole store.

Case Study: A Toronto Seller’s Margin Problem Was Hiding in COGS1
A Toronto home-goods seller had growing revenue, but profit was barely improving. The financial statements showed gross margins around 60%, so product cost did not seem like the obvious place to look.
The Problem
One high-volume product sold for $85 and carried a $33 unit cost in the accounting system. That $33 represented the supplier price, while freight, duties, brokerage, and inbound shipping were recorded elsewhere.
Once those costs were properly included, the unit economics changed:
| Product Economics | Reported | After Review |
|---|---|---|
| Selling price | $85 | $85 |
| Product cost | $33 | $43 |
| Gross profit per unit | $52 | $42 |
| Approx. gross margin | 61% | 49% |
That $10 difference per unit becomes $5,000 across 500 units.
What Gets Checked
The cost in the books is compared with the costs actually required to bring the inventory in. The review also looks at how the unit cost of the highest-volume products has changed over time. A useful check is:
- What did this SKU cost 12 months ago?
- What does it cost now?
- Which part of the cost increased?
- Did the selling price change too?
Result
Most of the product line was still healthy. One high-volume SKU had simply become much more expensive while its price barely moved.
That gave the founder a specific product to investigate instead of assuming the entire business needed cost cuts.
Useful takeaway: Compare the current landed cost of the five products generating the most sales with what those same products cost a year ago.
The Second Place an Ecommerce Accountant Checks: Selling Fees
Once COGS is reliable, the next check is what it costs to complete the sale. This is particularly important in ecommerce because several relatively small fees can hit the same order.
Shopify, Amazon, and Payment Fees Stacking Up
A Shopify seller may be paying payment processing, transaction, subscription, and app costs. The exact Shopify payment rates also vary by plan.
Amazon sellers have a different cost structure, including referral fees and potentially fulfilment, storage, and other Amazon selling fees. The important question is not whether these fees exist. It is whether anyone knows what they are doing to margin.
For example, a $70,000 bank deposit does not tell you how much customers actually purchased or how much disappeared through:
- Refunds
- Processing fees
- Marketplace fees
- Fulfilment
- Adjustments
The effect becomes much clearer when Shopify fees are measured against profit margin rather than disappearing inside the payout.
Shopify fees getting harder to separate as volume grows? Get the accounting underneath Shopify sales and payouts cleaned up.
Ad Spend That Isn’t Tied to Actual Profit Per Order
Advertising is another place where sales can grow while margin gets worse. Suppose an order has $45 left after product cost, fulfilment, and selling fees.
At $20 of advertising cost, the order still leaves $25. At $40, only $5 remains.
| Per Order | Scenario A | Scenario B |
|---|---|---|
| Amount left before ads | $45 | $45 |
| Advertising cost | $20 | $40 |
| Amount remaining | $25 | $5 |
The accounting role is not to decide which campaign should be paused. It is to make sure the founder can see what each sale is actually leaving behind before making that decision.
The Third Place an Ecommerce Accountant Checks: Contribution Margin by Product
Gross margin answers an important question, but it stops at COGS. Contribution margin goes further by considering the variable costs required to generate and fulfil the order. Depending on the business, that can include:
- Product cost
- Platform and payment fees
- Fulfilment
- Returns
- Variable advertising
What remains is much closer to what the sale actually contributes toward payroll, software, overhead, and eventual profit.

Products Propping Up the Business vs. Products Dragging It Down
Imagine two products each generate $100,000 in sales. One leaves $30,000 after its variable costs, while the other leaves only $4,000.
From the revenue report, they look equally important. Financially, they are doing very different jobs. That is why ecommerce contribution margin becomes important once revenue alone stops explaining what is happening to profit.
Why Blended Margins Hide the Real Problem
A 25% company-wide margin might look fine until the products underneath it are separated.
| Product | Contribution Margin |
|---|---|
| Product A | 39% |
| Product B | 28% |
| Product C | 16% |
| Product D | -2% |
The 25% average hides Product D completely. If that product suddenly becomes the fastest-growing SKU, sales can rise while the overall margin starts moving backwards.
Case Study: A Mississauga Seller’s Bestseller Was Barely Making Money2
A Mississauga apparel seller had one obvious bestseller. It generated the most orders and received the most advertising support, so the founder naturally assumed it was also one of the strongest products financially.
The Problem
The regular selling price was $60, but promotions brought the average actual price closer to $54. Once the main variable costs were assigned to the product, the economics looked very different.
| Per Order | Amount |
|---|---|
| Revenue after discounts | $54 |
| Product cost | -$19 |
| Fulfilment and shipping | -$7 |
| Platform/payment fees | -$3 |
| Average return impact | -$5 |
| Advertising | -$21 |
| Contribution | -$1 |
Another product in the same store sold fewer units but left roughly $14 per order after similar variable costs.The bestseller was winning on revenue. It was not winning on contribution.
What Gets Checked
The highest-volume products are compared using the same inputs so the reason for weak margin becomes visible:
- Actual selling price after discounts
- Product cost
- Fulfilment
- Platform and payment fees
- Returns
- Advertising cost
- Contribution left per order
That distinction is important. A weak product margin caused by supplier cost needs a different response from one caused mainly by returns or heavy discounting.
Result
In this case, product cost was not the biggest issue. Promotions, acquisition cost, and returns were doing most of the damage. The founder now had much better information for pricing, promotion, and marketing discussions instead of assuming the product with the most orders deserved even more attention.
Useful takeaway: Rank the top five SKUs once by revenue and again by contribution profit. A bestseller can fall surprisingly far down the second list.
The Fourth Place an Ecommerce Accountant Checks: Fixed Costs
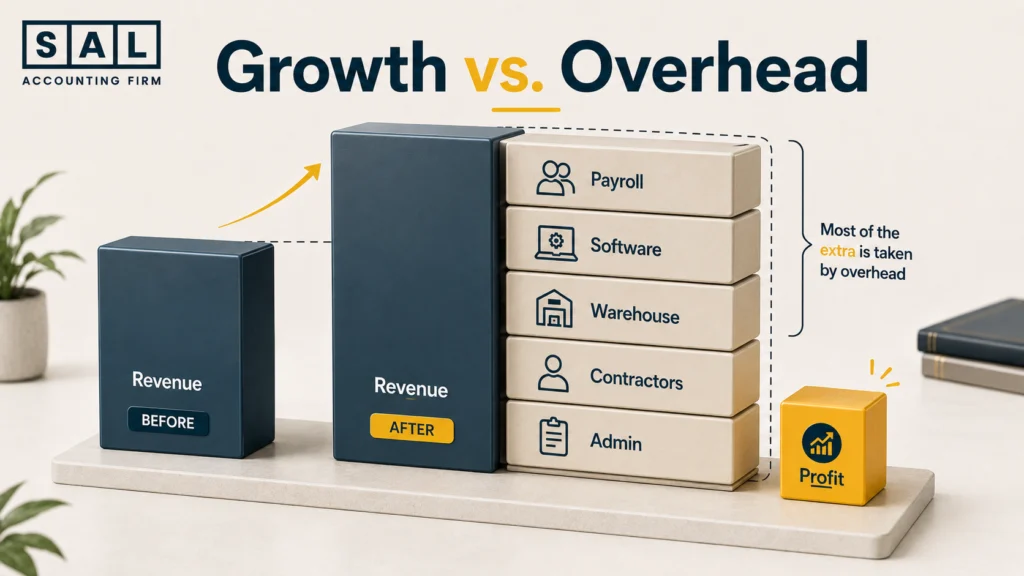
Sometimes the products themselves are still producing reasonable margins. The business has simply become more expensive to operate as it grew. Common areas to review include:
- Payroll
- Software subscriptions
- Warehouse costs
- Contractors
- Professional fees
- Administrative costs
These expenses are not automatically a problem. Growth usually requires more infrastructure.
Overhead That Grew Faster Than Sales
The useful comparison is how much additional gross profit the business generated versus how much additional overhead it added. For example:
| Growth Period | Scenario A | Scenario B |
|---|---|---|
| Additional gross profit | $300,000 | $300,000 |
| Additional fixed costs | $80,000 | $280,000 |
| Additional amount remaining | $220,000 | $20,000 |
Both businesses grew sales. Only one converted much of that growth into additional profit.
Payroll and Software Costs Creeping Up Unnoticed
These costs often build slowly. One new employee, three extra apps, an upgraded platform subscription, and another contractor may each make sense separately. Together, they can absorb much of the margin created by higher sales.
Pro tip: Review recurring expenses against both revenue and gross profit. A perfectly legitimate expense can still be growing faster than the business can support.
The Fifth Place an Ecommerce Accountant Checks: Pricing and Discounts
The final check is whether the selling price still fits the current cost structure. A product may have been priced correctly when it launched, but supplier cost, freight, fulfilment, payment fees, and advertising rarely stay frozen. If all of those move while the price stays still, the margin gets compressed little by little.
Discount Codes and Promotions Eating Into Margin
Discounts can accelerate that compression. Take a product with $60 of variable costs:
| Full Price | 20% Discount | |
|---|---|---|
| Selling price | $100 | $80 |
| Variable costs | $60 | $60 |
| Amount left | $40 | $20 |
The selling price fell by 20%, but the amount left fell by 50%.
That does not mean promotions are automatically unprofitable. It means they need to be judged by what happens to contribution, not just by the lift in orders.
Pricing That Hasn’t Moved While Costs Have
The review here can be surprisingly simple. Compare the same product today with a year ago:
- Has supplier cost increased?
- Has freight increased?
- Has fulfilment increased?
- Has acquisition cost increased?
- Has the average selling price moved too?
If most costs went up while the actual selling price barely changed, the reason for the margin squeeze may already be clear.

Signs Your Margin Problem Is Actually a Bookkeeping Problem
Sometimes the margin really is getting worse. Other times, the accounting cannot produce a reliable margin in the first place. Common warning signs include:
- Payouts recorded directly as revenue
- Platform fees missing or heavily lumped together
- Landed costs excluded from product cost
- Inventory balances that cannot be supported
- Large COGS corrections only at year-end
- Returns recorded inconsistently
- No profitability reporting by SKU
Those are the same kinds of problems that make ecommerce bookkeeping difficult to trust.
Pro tip: Ask for the contribution profit of the three highest-revenue products last month. If getting the answer requires rebuilding several spreadsheets, the reporting setup probably needs attention before major pricing decisions are made.
What an Ecommerce Accountant Looks At: A Quick Reference
| Area Checked | What It Reveals | Common Culprit |
|---|---|---|
| COGS | Whether product margin is real | Missing landed costs |
| Selling fees | Cost of completing the sale | Platform/payment costs rising |
| Contribution margin | Which products actually create profit | Weak SKUs hidden by averages |
| Fixed costs | Whether growth is getting too expensive | Payroll, software, overhead |
| Pricing | Whether price still fits current costs | Costs rose while price stayed flat |
| Discounts | What promotions really leave behind | Revenue gained at too little margin |
The point is not to inspect every expense in the business. It is to identify which part of the margin explains why higher sales are not producing higher profit, then focus attention there instead of changing everything at once.