eCommerce contribution margin shows what your store keeps after product cost, fees, shipping, returns, discounts, and ad spend. It explains why sales can look strong while cash still feels tight. For growing Shopify, Amazon, and WooCommerce sellers, SAL Accounting focuses on what was actually left behind, not just what came in.
By the end of this post, your sales won’t just look busy. You’ll know which orders, products, and ads are actually pulling their weight.
Running mainly on Shopify? Start by seeing how much the platform may already be taking with the Shopify Fee Calculator.
Quick Takeaways
- eCommerce contribution margin shows what is left after variable costs.
- Contribution margin ratio, or CM%, shows how much of each sales dollar your store keeps.
- Gross margin is useful, but it usually misses fees, shipping, returns, and ads.
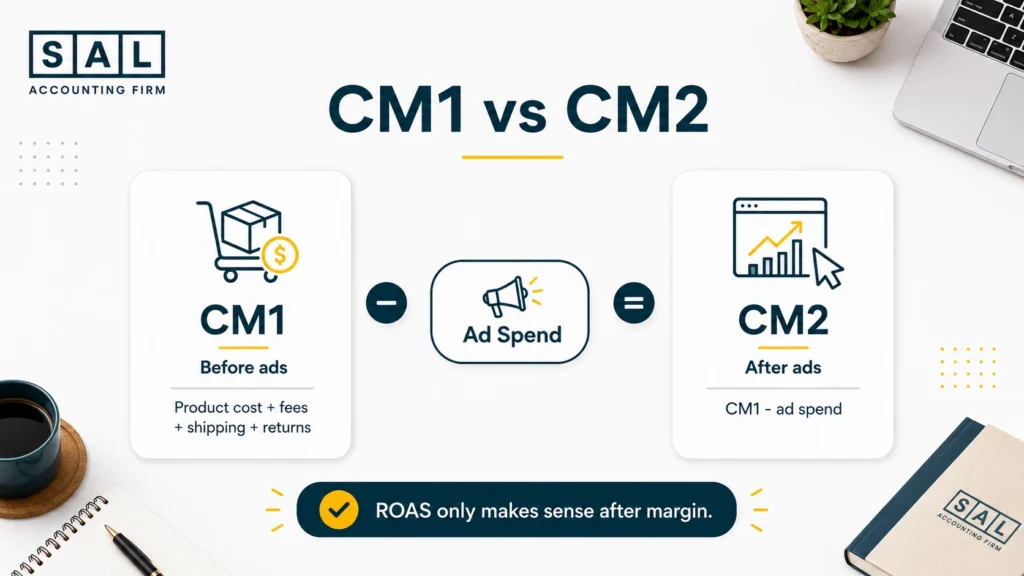
- CM1 shows margin before ad spend.
- CM2 shows margin after ad spend.
- ROAS can look good while the contribution margin is weak.
- The goal is not just more sales. The goal is sales that leave money behind.
What Is eCommerce Contribution Margin?
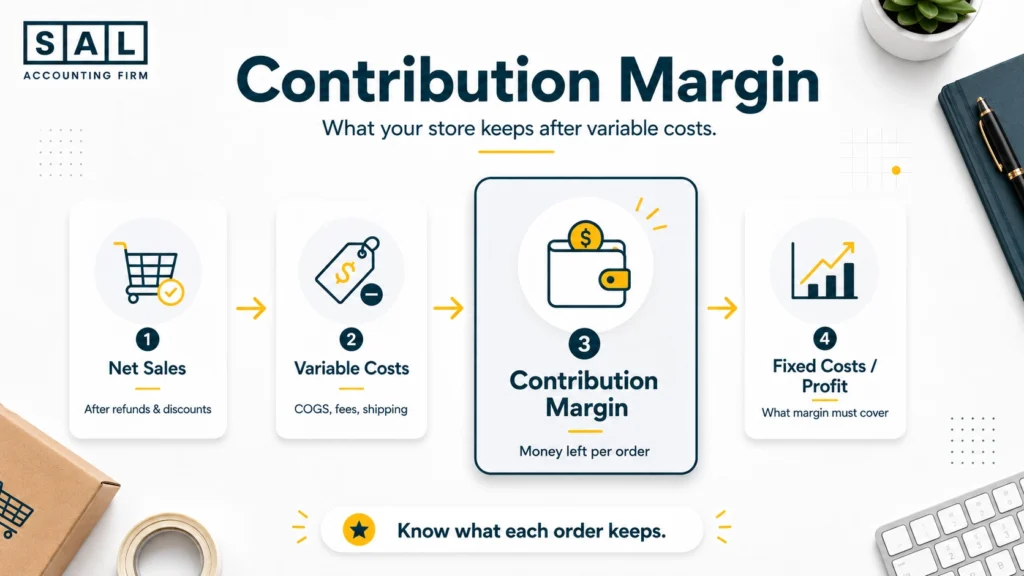
eCommerce contribution margin shows what your store keeps after the costs tied to each order are removed. Basically, it answers one simple question:
After this order is sold, packed, shipped, refunded if needed, and paid for through the platform, how much money is actually left?
The simple formula is:
Contribution Margin = Net Sales – Variable Costs
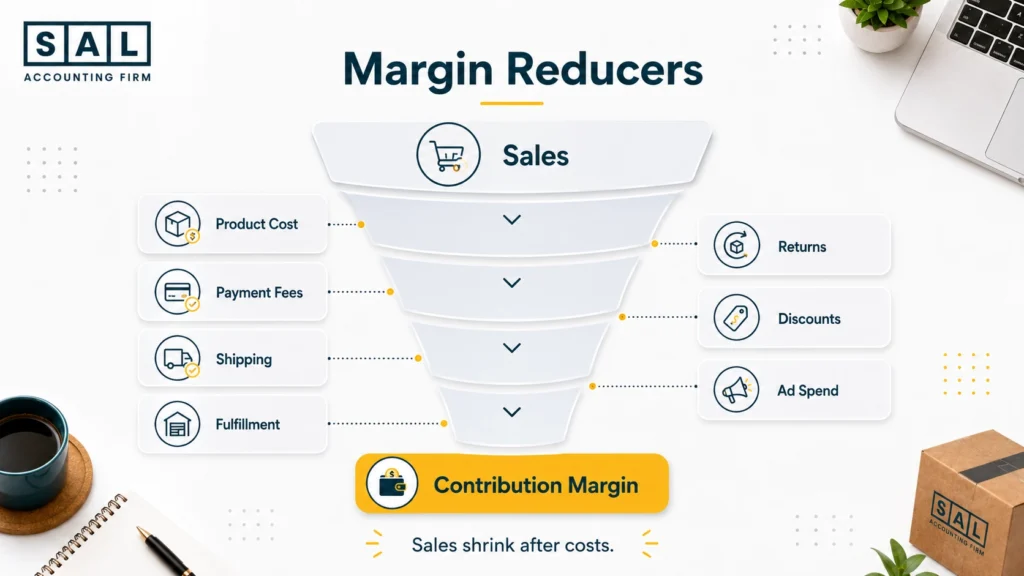
For an online store, variable costs usually include:
- product cost
- payment fees
- platform fees
- shipping
- fulfillment
- discounts
- refunds
- return costs
- ad spend, when calculating CM2
A $100 order is not really worth $100 to your business if product cost, fees, shipping, and ads take most of it away. Contribution margin shows the number that is left to cover fixed costs and profit.
If your sales, payouts, fees, inventory, and tax are getting harder to separate, SAL’s e-commerce bookkeeping for online stores can show what happened in the store, not just what landed in the bank.
How Do You Calculate Contribution Margin for an eCommerce Store?
Start with net sales, not gross sales. Gross sales show what customers paid before discounts, refunds, and adjustments. Net sales show the cleaner number after those changes. Shopify separates these ideas in its sales reports, but your accounting still needs to bring the full sale, payout, fee, refund, and tax picture together.
From there, subtract the costs that belong to the order. Here’s a simple example:
| Item | Amount | What It Means |
|---|---|---|
| Net sales | $100 | Sale after discounts/refunds |
| Product cost | $35 | Cost of the item sold |
| Payment fee | $4 | Processing cost |
| Shipping/fulfillment | $12 | Delivery and handling |
| Return allowance | $6 | Expected return cost |
| CM1 | $43 | Left before ad spend |
| Ad spend | $20 | Cost to get the order |
| CM2 | $23 | Left after ad spend |
So in this example, the order has:
- $43 CM1 before ads
- $23 CM2 after ads
That difference matters. CM1 tells you whether the product and order economics make sense. CM2 tells you whether the order still works after paid acquisition.
For many stores, the first messy spot is e-commerce payment reconciliation, because the sale, payout, refund, tax, fee, and bank deposit rarely appear as one neat number.
What Costs Should You Include in eCommerce Contribution Margin?
Include costs that move with each order. That usually means:
| Cost | Include in CM? | Why | Example |
|---|---|---|---|
| Product cost | Yes | Sold with each order | Unit cost |
| Payment fees | Yes | Taken from sales | Shopify Payments, Stripe |
| Shipping | Yes | Order-driven | Free shipping subsidy |
| Fulfillment | Yes | Order-driven | 3PL, FBA, pick-pack |
| Discounts | Yes | Reduces net sales | Promo code |
| Returns | Yes | Reduces margin | Refund + return label |
| Ad spend | CM2 | Shows paid growth quality | Meta, Google |
| Payroll | No | Usually fixed | Admin staff |
| Rent | No | Usually fixed | Office/storage |
Product cost is the first number to clean up. If COGS is wrong, every margin number after it becomes shaky. For Shopify sellers, COGS for Shopify and Shopify payment reconciliation are usually where product costs, payouts, fees, refunds, and tax start to make more sense.
- Also read: “How to Calculate COGS for eCommerce Stores“
What Is Contribution Margin Ratio in eCommerce?
Contribution margin ratio, or CM%, shows what percentage of net sales is left after variable costs. The formula is:
Contribution Margin Ratio = Contribution Margin / Net Sales x 100
Example:
- Net sales: $100
- Variable costs: $60
- Contribution margin: $40
- CM%: 40%
Every $100 in sales leaves $40 before fixed costs. That $40 still needs to cover software, payroll, accounting, rent, creative, admin, and profit.
This is where eCommerce owners often get surprised. A product with strong sales can still be weak if it needs too much discounting, expensive shipping, or heavy ad spend to move.
Contribution Margin vs Gross Margin: What’s the Difference?
Gross margin is useful, but it does not show the full eCommerce picture. Contribution margin goes deeper.
| Metric | What It Shows | Usually Includes | Best For |
|---|---|---|---|
| Gross margin | Product profit | Sales minus COGS | Pricing and sourcing |
| Contribution margin | Order-level profit | COGS, fees, shipping, returns | Scaling decisions |
| CM1 | Margin before ads | Product + order costs | Product quality |
| CM2 | Margin after ads | CM1 minus ad spend | Paid growth |
Gross margin might tell you that your product has room to make money. Contribution margin tells you whether it still makes sense after the real selling costs show up.
Example: Your gross margin may look strong because your product costs $30 and sells for $100. But after a 15% discount, $12 shipping subsidy, $4 payment fee, $7 fulfillment cost, and $25 ad spend, the margin story changes quickly.
That gap is exactly why Shopify profit calculation mistakes are so common. The sale is easy to see. The margin leaks are usually spread across different reports.
If you want the bigger reporting view, eCommerce financial statements show how margin, expenses, cash flow, and profit fit together beyond a single order.
CM1 vs CM2: Should Ad Spend Count in eCommerce Margin?
Yes, but separate it clearly. Use CM1 and CM2 so you do not mix product margin with paid growth margin.
- CM1 = net sales minus product, payment, shipping, fulfillment, returns, and discounts.
- CM2 = CM1 minus ad spend.
CM1 tells you whether the product or order works before ads. CM2 tells you whether paid acquisition still leaves money behind. This matters because ROAS can be misleading.
Example: Let’s say your ad has a 3x ROAS. That sounds good. But if your contribution margin before ads is only 30%, you may be close to break-even once other costs are included.
Sometimes the answer is not “run better ads.” It may be pricing, bundles, shipping rules, or discount control. That is why eCommerce pricing strategy belongs in the same conversation as contribution margin.
Case Study: How a Skincare Brand in Liberty Village, Toronto Found Its Real Shopify Contribution Margin
A skincare founder in Liberty Village, Toronto is growing quickly through Shopify. Her dashboard looks strong, Meta ads are bringing in orders, and bundles are selling well. But the bank account still feels tighter than expected.
The store is not failing. The numbers just are not showing sales, fees, shipping, discounts, returns, and ads in one place.
The Problem
The team is looking at revenue and ROAS, but not true contribution margin. A bundle looks profitable until shipping subsidies, payment fees, return rates, and ad spend are included.
What We Do
We would rebuild the margin view by SKU, bundle, and channel. The review would start with net sales, then separate product cost, Shopify fees, shipping, fulfillment, discounts, refunds, and ad spend.
Result
The founder can see which products deserve more ad spend, which bundles need pricing changes, and where free shipping is cutting into profit. Cleaner numbers make the next growth decision much easier.
In stores like this, Shopify inventory accounting can change the whole picture because product cost is not useful if it does not match what was actually sold.
How Contribution Margin Affects CAC, ROAS, Break-Even, and Cash Runway
Contribution margin shows whether growth is healthy. Here’s the simple version:
- CAC tells you what it costs to get a customer.
- ROAS tells you how much revenue ad spend generated.
- Break-even ROAS tells you the ROAS needed to avoid losing money.
- Cash runway tells you how long the business can keep operating.
Now, here’s the catch. If your contribution margin is weak, you need a higher ROAS just to break even. Break-even ROAS can be estimated like this:
Break-even ROAS = 1 / contribution margin before ads
If your pre-ad CM% is 40%, your break-even ROAS is 2.5.
So if your ads are getting 2.2 ROAS, that may look decent inside the ad platform, but the order can still lose money after costs. BDC’s break-even point guide explains the bigger idea: sales need to cover costs. In eCommerce, contribution margin brings that down to each order, product, or channel.
The same issue appears in cash flow forecasting: sales can grow while cash gets tighter if inventory, ads, refunds, and shipping move faster than profit.
Pro Tip: Do not judge paid ads only inside Meta, Google, or TikTok. Pull the numbers back into your margin report so you can see what the sale actually left behind.
How to Track Contribution Margin by Order, SKU, Channel, and Store
You do not need a complicated dashboard to start. You need clean categories. Track contribution margin at four levels:
| Level | What It Shows | Best Question | Example |
|---|---|---|---|
| Order | Profit per sale | Did this order leave money? | Single Shopify order |
| SKU | Product margin | Should we push this item? | Best-selling hoodie |
| Channel | Platform/ad margin | Where should the budget go? | Amazon vs Shopify |
| Store | Total margin | Can the business cover fixed costs? | Monthly P&L |
For each platform, the contribution margin gets messy in a different place.
| Platform | What Usually Gets Messy | What to Watch |
|---|---|---|
| Shopify | Payouts, fees, refunds, discounts | Product cost and payment timing |
| Amazon | Referral fees, FBA fees, storage, returns | Settlement reports and ad spend |
| WooCommerce | Payment processors, tax setup, plugins | Clean sales and tax mapping |
For Shopify stores, Shopify accounting should show what the store keeps after product costs, fees, refunds, discounts, and payout timing. If the tools are part of the problem, accounting software for Shopify sellers can shape how cleanly those numbers move into your books.
For Amazon, the numbers need a different kind of cleanup. Amazon’s selling fee schedule shows how many fee layers can sit behind one sale. That is why Amazon FBA bookkeeping should go beyond recording deposits.
For WooCommerce, the bigger issue is usually setup. Store data, payment processors, tax settings, and accounting software all need to line up, or WooCommerce tax setup can make sales and tax harder to separate later.

Common Mistakes That Make Contribution Margin Look Better Than It Is
This is one of the easiest numbers to get wrong. Not because owners are careless. Usually, it is because the data lives in too many places. Common mistakes include:
- recording payouts as revenue
- ignoring payment fees
- using product cost but not landed cost
- missing refunds and chargebacks
- treating shipping as a fixed cost
- forgetting return labels
- leaving discounts out of the margin view
- judging products only by revenue
- using ROAS without contribution margin
- mixing fixed and variable costs
Example: If Shopify shows $40,000 in sales but $34,500 hits the bank, that does not mean revenue is $34,500. It usually means fees, refunds, taxes, chargebacks, or other adjustments happened before the payout reached your account.
A clean margin report needs clean eCommerce reconciliation. When the platform, processor, bank, and accounting software all tell slightly different stories, the margin number becomes shaky.
And if this sounds familiar, you are not alone. Many of the same issues show up in broader eCommerce accounting mistakes, especially when the books were set up before the store became more complex.
- Read more: “Common Shopify Profit Calculation Mistakes“
How Can You Improve Contribution Margins in an eCommerce Store?
Improving contribution margin does not always mean raising prices. Sometimes it means finding the small leaks that happen on every order. Start here:
- Review products with high sales but low CM%.
- Check whether free shipping is actually paying off.
- Reduce discounts that lift sales but shrink profit.
- Review return-heavy products.
- Compare ad spend by product, not just campaign.
- Build bundles that lift average order value.
- Review payment and platform fees.
- Track landed cost, not just supplier cost.
- Stop scaling channels with weak CM2.
- Close the books monthly, not once a year.
A lot of margin decisions get clearer once eCommerce business expenses are separated properly. Tax time is easier too, because your eCommerce tax deductions are not buried inside messy operating numbers.
Pro Tip: If a product sells fast but needs heavy discounts, expensive shipping, and constant ad spend, it may be a busy product, not a profitable one.
How Does Sales Tax Affect eCommerce Contribution Margin?
Sales tax usually does not reduce contribution margin the same way product cost, shipping, or ad spend does. But it can still make your margin look wrong. Why? Because sales tax collected is not really your store’s money. If it gets mixed into revenue, refunds, payouts, or accounting software, your margin report can start telling the wrong story.
Canadian GST/HST
For Canadian sellers, this usually starts with GST/HST. If you are not sure whether registration applies yet, the CRA’s GST/HST registration guidance and small supplier rules are the right places to check first. Once you are registered, the CRA’s GST/HST rates guide helps confirm which rate applies. Inside your own numbers, keep an eye on:
- tax collected
- tax paid
- refunds
- platform payouts
- sales tax payable
If those numbers are starting to blur together, the GST/HST Refund Calculator for eCommerce Stores can give you a cleaner starting point before you review the books.
US Sales Tax
US sales add another layer because sales tax rules can vary by state. Sales Tax Institute’s economic nexus chart is useful when your US sales are growing and you need to see where thresholds may come into play. The point is not to turn contribution margin into a tax calculation. The point is to keep:
- sales
- tax collected
- refunds
- payouts
- tax payable
clean enough that your margin report actually makes sense.
For more detail, GST/HST compliance for eCommerce stores covers the Canadian side, while US sales tax requirements for Canadian sellers is the better next step once state-by-state US sales start showing up.
Case Study: How a Pet Product Brand in Port Credit, Mississauga Compared Shopify and Amazon Margins
A pet product brand in Port Credit, Mississauga sells through Shopify and Amazon. Sales are growing in Canada and the US, but the owner is not sure which channel is actually worth scaling. Amazon has higher volume. Shopify looks cleaner. Neither picture is complete without a contribution margin.
The Problem
Amazon sales look strong, but FBA fees, referral fees, storage, returns, and ads reduce what is actually left. Shopify looks better at first, but paid acquisition costs make some campaigns weaker than expected.
What We Do
We would separate Shopify, Amazon Canada, Amazon US, and paid ad channels. Then we would calculate CM1 and CM2 by channel so the owner can compare what each sales path actually leaves behind.
Result
The owner can stop asking, “Where are we getting the most sales?” and start asking, “Where are we keeping the most money?” That is the difference between busy growth and healthier growth.
For a business split across both platforms, Shopify vs Amazon FBA is not just a platform decision. It changes fees, fulfillment, payout timing, reporting, and margin.
- Read more: “Online Pet Store Accounting Guide“
eCommerce Contribution Margin Calculator: What to Include
A useful contribution margin calculator does not need to be fancy. It just needs to separate the numbers in the right order. Start with four groups:
- Sales numbers: Gross sales, discounts, refunds, and net sales.
- Product and order costs: Product cost, landed cost, payment fees, platform fees, shipping, fulfillment, and return costs.
- Growth costs: Ad spend, CAC, and any campaign costs tied to the order or channel.
- Margin outputs: Contribution margin, CM%, CM2, and CM2%.
Keep contribution margin separate from EBITDA. Contribution margin shows what each sale leaves behind. EBITDA looks at the business from a higher level after operating expenses.
Once you have cleaned up order-level margin, the Ecommerce EBITDA Calculator can help you compare revenue, COGS, marketing spend, and operating expenses in one place. Both numbers are useful. They just answer different questions.
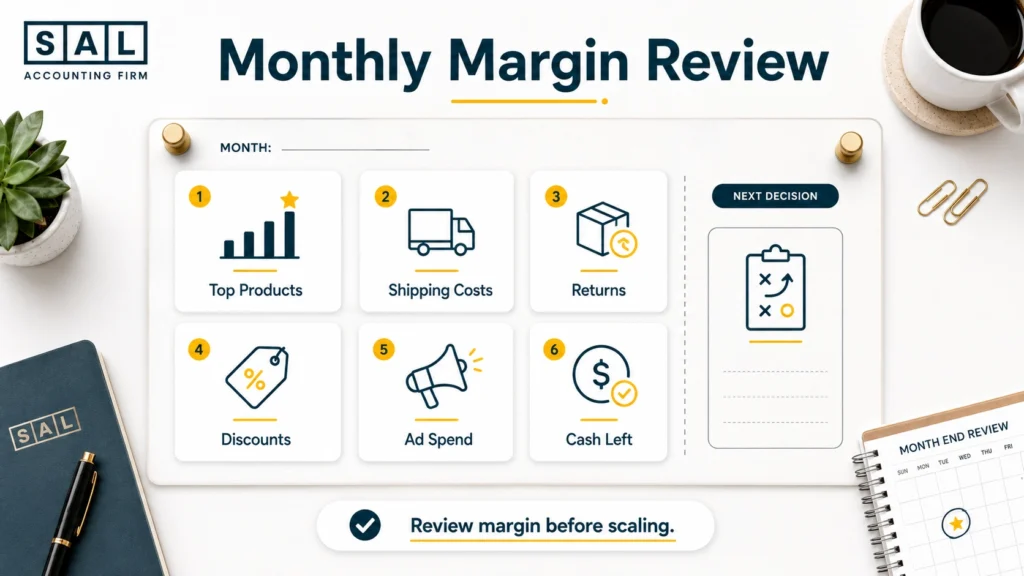
When Should You Review the Contribution Margin?
Review contribution margin monthly if your store has:
- growing ad spend
- multiple products
- frequent discounts
- returns or exchanges
- free shipping offers
- Amazon or Shopify fees
- cross-border sales
- inventory purchases
- cash flow pressure
A monthly review does not have to be overwhelming. Start with your top products and main channels first. After that, the rest of the numbers become easier to read.
A Shopify month-end close checklist is useful here because contribution margin is much harder to trust when the month is still full of open payouts, refunds, inventory changes, and unreconciled fees.
For tax season, the Tax Document Checklist for eCommerce Stores can also keep platform reports, bank records, tax details, and accountant access from turning into a last-minute scramble.
Pro Tip: Do not wait until tax season to find out your margins were weak. Contribution margin is a monthly decision tool, not just a year-end accounting number.
Final Thoughts: Before You Scale, Know What’s Actually Left
Revenue can make your store look busy. Contribution margin shows whether that activity is actually leaving money behind. Before you increase ad spend, add more SKUs, or push harder into Shopify, Amazon, or WooCommerce growth, make sure the numbers underneath the sales still make sense. The goal is not just to sell more. It is to understand which orders, products, and channels are worth scaling.
If your numbers still feel hard to trust, talk to SAL Accounting and get a clearer view of what needs to be fixed, tracked, or reviewed next.