
Most Canadian ecommerce businesses aren’t profitable, not because they’re doing something wrong, but because the costs quietly reducing every sale are invisible until it’s too late. The average net profit margin in ecommerce sits between 4–10%, and for many sellers it’s even thinner.
At SAL Accounting, we’ve seen stores doing $300K in revenue with $18K left at year end. This post breaks down the seven real reasons your store isn’t making money and how to fix each one.
Run your numbers through the Shopify Fee Calculator. It’s usually the first place the gap starts to make sense.
Quick Takeaways
- Most ecommerce margin problems start with a bookkeeping error, not a marketing one
- Recording Shopify payouts as revenue is the single most common cause of inaccurate profit figures
- Your cost stack has 7 layers and most sellers only account for 2 or 3
- A healthy ecommerce business runs at CM1 above 30% and LTV:CAC of 3:1 or higher
- Canadian sellers selling into the US may have GST/HST and sales tax obligations they don’t know about
- Fixing the wrong layer first is the most common reason a profitability problem drags on for months
What Is the Difference Between Revenue and Profit in Ecommerce?
Most store owners watch sales, celebrate big months, and assume the money is there. It isn’t, because revenue and profit are not the same thing. Before anything else, here’s what each term actually means:
- Gross revenue: what customers paid before any deductions
- Shopify payout: what Shopify deposits after deducting fees, refunds, and adjustments. Not your revenue.
- Contribution margin (CM1): revenue minus COGS, shipping, fees, and returns
- CM2: CM1 minus paid advertising spend
- MER (Marketing Efficiency Ratio): total revenue divided by total ad spend
If you’re not measuring your store through proper bookkeeping, you’ll never know which number is the actual problem.
| Metric | What It Measures | Healthy Benchmark | Warning Sign |
| CM1 | Revenue minus all variable costs | 30–50% | Below 20% — losing money per order |
| CM2 | CM1 minus paid marketing | 15–35% | Negative — ads erasing profit |
| LTV:CAC | Lifetime value vs. acquisition cost | 3:1 or higher | Below 2:1 — growth unsustainable |
| CAC | Marketing spend ÷ new customers | $53–$377 by vertical | Above 33% of LTV |
| MER | Revenue ÷ total ad spend | 3x–5x | Below 2.8x |
| AOV | Revenue ÷ orders | Varies by niche | Flat AOV with rising CAC |
| Conversion Rate | Buyers ÷ visitors | 2–4% | Below 1% — traffic is wasted |
What Are the Biggest Reasons Your Online Store Doesn’t Make Money?
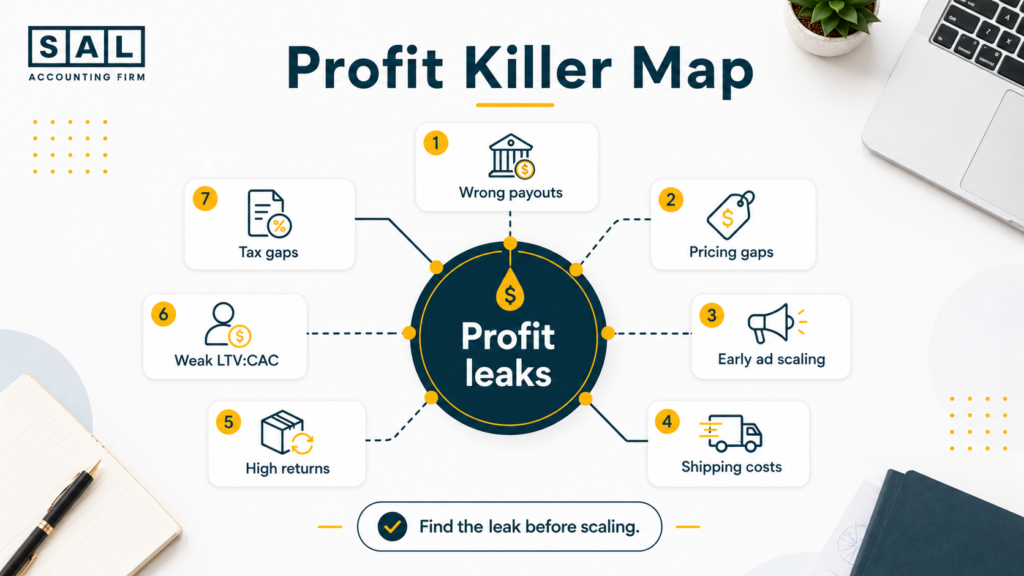
The seven most common causes:
- Recording platform payouts as revenue instead of gross sales
- Pricing without accounting for the full cost stack
- Scaling ad spend before conversion rate is ready
- Uncontrolled shipping costs
- High return rates eroding acquisition investment
- Broken LTV:CAC with no retention strategy
- Unresolved GST/HST or US sales tax compliance gaps
1. You’re Recording Payouts as Revenue — And It’s Breaking Your Books
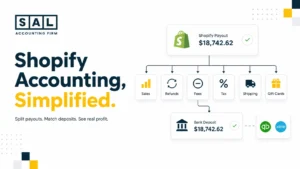
If your store did $50,000 in sales, Shopify might deposit $43,000. Most bookkeepers record $43,000 as revenue. That’s wrong, and it distorts every number downstream: your margin, your tax filings, your pricing decisions.
This is exactly the gap that Shopify payment reconciliation addresses. In most cases we see, this error alone accounts for a 10–20% gap between what sellers think their revenue is and what a proper P&L would show. And it’s often the first thing that separates an ecommerce accountant from a general one.
The fix: Record gross revenue. Categorize fees, refunds, and adjustments as separate line items.
Pro Tip: Compare your Shopify gross sales report to your bank deposits for the same month. If they don’t match, your books are wrong and every profit figure downstream is too.
- Also Read: “Shopify Profit Calculation Mistakes“
2. Your Pricing Doesn’t Account for the Full Cost Stack
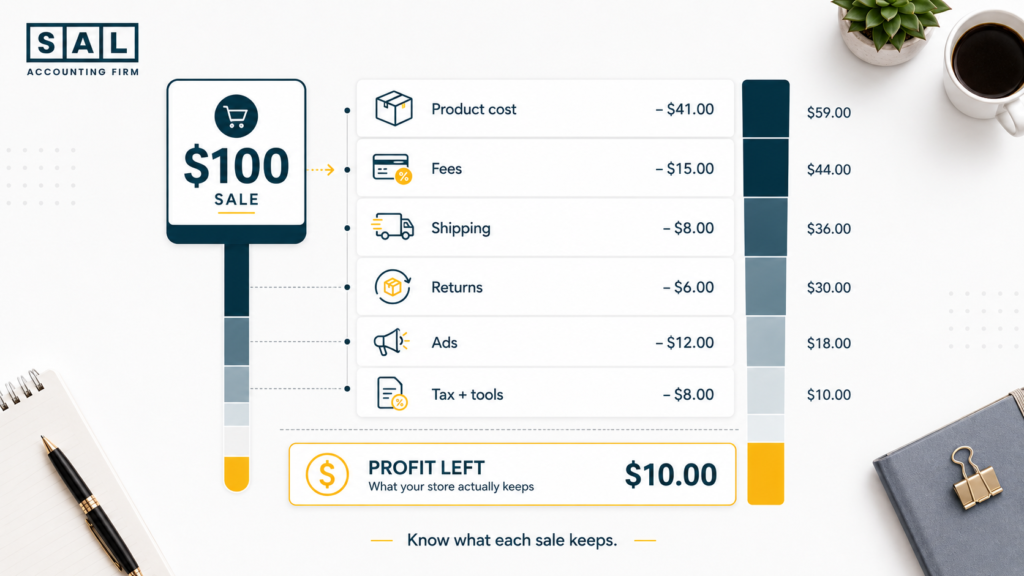
Product cost × 2 isn’t a pricing strategy. Here’s what most sellers forget to build in:
| Cost Category | Typical % of Revenue | Commonly Missed? | Impact If Ignored |
| Product / COGS | 30–60% | No | Foundation |
| Platform Fees | 2–6% | Partial | Kills low-ticket margins |
| Payment Processing | 2.9% + 30¢/order | Often | Compounds at volume |
| Shipping & Fulfillment | 10–20% | Partial | Free shipping destroys margin |
| Returns & Chargebacks | 5–30% in fashion | Yes | Lost CAC on every return |
| Paid Advertising | 15–30% | Partial | Rising CPMs year-over-year |
| GST/HST & US Sales Tax | 5–15% | Frequently | Compliance risk + cash shock |
| Overhead & Tools | 5–10% | Yes | Should stay under 30% of revenue |
Getting COGS right is the starting point. The COGS guide for Shopify covers this in detail. Pricing within this full stack is also where ecommerce pricing strategies become a margin question, not just a marketing one.
The fix: Know your CM1 per product before setting any price.
3. You’re Scaling Ad Spend Before Your Store Is Ready to Convert
The average Shopify store converts at 1.4% according to Shopify’s conversion rate benchmarks. Top stores hit 3–4%. If you’re at 0.8% and scaling Meta spend, you’re scaling losses.
Common culprits: slow page speed, no trust signals, late-revealed shipping costs, descriptions written for search engines, and poor mobile UX. Over 70% of Shopify traffic is mobile per Shopify’s commerce report.
The fix: Get to 2%+ conversion before scaling any paid traffic. Audit your top product pages first. Checkout friction, missing trust signals, and slow load speed are the three most fixable issues and usually the biggest culprits.
Pro Tip: Install Microsoft Clarity or Hotjar (both free) and watch session recordings for your top pages. You’ll see exactly where people leave — and most of the time it’s fixable without a developer.
4. Shipping Costs Are Quietly Eating Your Margin
Shipping should sit at 10–15% of revenue, according to Onramp Funds’ ecommerce benchmarks. Many Canadian sellers are at 20%+ once dimensional weight pricing, brokerage fees, and the reality that Canadian cross-border shipping is structurally more expensive than US domestic rates are factored in.
The fix: Calculate your true per-order shipping cost. Set free-shipping thresholds based on your actual numbers, not competitor benchmarks.
5. Your Return Rate Is Higher, and Costlier, Than You Think
Every return costs more than just the lost sale. Here’s what each one actually takes from you:
- The original outbound shipping cost
- Return shipping, if you’re covering it
- Restocking and processing labour
- The CAC you already paid to get that customer
- Potentially the resale value if the product arrives damaged
Fashion and apparel sellers can see return rates of 20–30%, as Shopify’s ecommerce returns guide shows, and cross-border Canadian-to-US returns add customs friction on top. It’s one reason clothing and apparel online store accounting needs its own margin model.
The fix: Audit returns by SKU. Your worst return offenders are usually your best-selling products.
6. Your LTV:CAC Ratio Is Broken
A healthy ecommerce business runs at an LTV:CAC of 3:1 or higher, according to Qubit Capital’s benchmarks. Most struggling stores look like this:
- CAC is rising as paid social costs climb year over year
- LTV is flat with no real repeat purchase strategy in place
- Payback period is over 90 days, meaning cash flow becomes a crisis before break-even
The Ecommerce EBITDA Calculator shows whether your business is generating real operating profit or just cycling cash. And according to Shopify’s customer retention research, repeat customers spend 67% more per order than first-time buyers. That gap is your retention opportunity.
The fix: Build retention before scaling acquisition.
Pro Tip: Monthly LTV averages hide the difference between customers who buy once and those who come back four times a year. Segment by cohort — first purchase month — before optimizing anything.
7. You Have a Tax Compliance Gap You Don’t Know About
The CRA sets the GST/HST registration threshold at $30,000 CAD — details are in the CRA’s small supplier rules. Cross it without registering and you’re personally liable for uncollected tax. The issues we see most:
- Not registering after crossing $30,000. What happens in that scenario is worth knowing now
- Misreading marketplace facilitator rules. Shopify remits GST/HST in some contexts, but not all
- Triggering US economic nexus in California, New York, or Texas without filing
- Leaving Input Tax Credits (ITCs — recoverable tax on eligible Canadian business purchases) unclaimed
The US sales tax requirements for Canadian sellers are worth understanding before your US volume grows. The US Economic Nexus Threshold Checker shows your current exposure, state by state.
The fix: Check your GST/HST position and US nexus before they surface on their own.
- Also Read: “GST/HST Compliance for Ecommerce Stores“
Case Study: How Marcus in Leslieville, Toronto Stopped Losing Money Despite Record Sales1
Marcus runs a premium skincare brand from his studio in Leslieville, Toronto. His Shopify store does $180,000 CAD in annual revenue with solid ROAS and growing reviews. His bank account tells a completely different story.
The Problem: His bookkeeper is recording Shopify payouts as revenue. Recorded revenue is $28,000 lower than reality, with $14,000+ in fees and refunds invisible in the books. Tax filings are inaccurate, pricing doesn’t reflect real unit economics, and he has unknowingly triggered US sales tax nexus in California and New York. His real contribution margin: 14%.
What We Do: We rebuild his books using proper Shopify methodology — gross revenue in, fees and adjustments separated. We identify products with negative CM2, flag nexus exposure, handle state registration, and correct GST/HST reporting.
The Result: CM rises from 14% to 34% within one quarter. He reprices two unprofitable SKUs, cuts a free-shipping offer costing $900/month, and avoids a US tax penalty that could reach $18,000+.
If your Shopify numbers tell a similar story, Shopify accounting in Toronto is the kind of support that makes the difference between guessing at your margin and actually knowing it.
How to Calculate Whether My Ecommerce Store Is Actually Profitable?
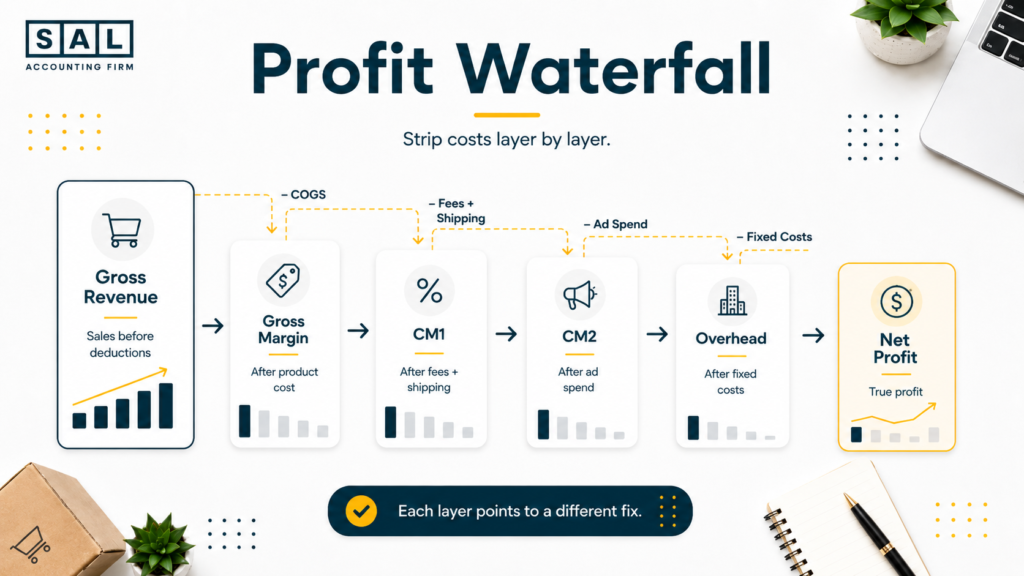
Strip costs away layer by layer. Each level tells you something different about where the business is breaking down.
| Level | Calculation | Healthy Benchmark | What It Tells You |
| Gross Revenue | All sales before deductions | Starting point | Total demand — not your money yet |
| Gross Margin | Revenue − COGS | 40–65% | Can you cover operations? |
| CM1 | Gross Margin − Shipping − Fees − Returns | 30–50% | Per-order variable profitability |
| CM2 | CM1 − Paid Marketing | 15–35% | Are ads profitable at unit level? |
| Contribution to Overhead | CM2 − Fixed Costs | 10–25% | Real operating profitability |
| Net Profit | After tax, interest, depreciation | 4–10% | True business health |
This waterfall is what proper ecommerce financial statements should reflect. If CM1 is healthy but CM2 is negative — ads are the problem. If CM2 is healthy but net profit is near zero (overhead or tax is the problem. If CM1 is below 20%) the issue is at unit economics level.
Pro Tip: Don’t change your ads, pricing, or shipping until you know which layer is broken. Fixing the wrong thing first is the most common reason a 90-day turnaround takes 18 months.
- Read More: “Shopify Profit Calculation Mistakes“
How to Fix Ecommerce Profitability in 90 Days?
Days 1–30: Get Accurate Numbers
- Rebuild bookkeeping to record gross revenue, not payouts
- Calculate real CM1 and CM2 per product
- Identify CAC by channel — not blended
- Flag GST/HST and US nexus gaps
- Start a weekly P&L review
Ecommerce reconciliation best practices are the right starting point. how you categorize transactions in month one affects every report afterward.
Days 31–60: Fix the Leaks
- Reprice products with negative CM2
- Audit shipping policy against actual per-order cost
- Pause ad spend on products with CM1 below 20%
- Run a return analysis by SKU
- Fix conversion rate before scaling traffic
Ecommerce business expenses that go unreviewed longest. Tools, subscriptions, platform add-ons are worth auditing here too.
Days 61–90: Make the Margin Last
- Launch a post-purchase email sequence for repeat orders
- Test bundles or upsells to raise AOV
- Run a real monthly P&L, not an estimate
- Review pricing quarterly against your real cost stack
- Confirm US nexus compliance in your top five states
- Also Read: “How to Prepare Your Ecommerce Business for Tax Season“
Case Study: How Priya in Port Credit, Mississauga Found $40,000 She Didn’t Know She Was Losing2
Priya sells home décor through her Shopify store and Amazon Canada from her warehouse in Port Credit, Mississauga. Combined revenue sits at $310,000 CAD. Net income at year-end: $18,000. She is considering shutting down.
The Problem: Amazon FBA fees are recorded as a lump cost instead of by ASIN, hiding two loss-leaders. Her free-shipping threshold is $35 but average shipping cost is $14.80. Most orders ship at a loss. She has $23,000 in unclaimed ITCs on Canadian imports, and two years of books are understated because her integration pulls payout data only.
What We Do: We rebuild Amazon cost structures at the ASIN level, as covered in the Amazon FBA bookkeeping guide. We recalculate shipping thresholds, file amended GST/HST returns to recover ITCs, and correct two years of Shopify bookkeeping.
The Result Net profitability rises from 5.8% to 14.2% in two quarters, without a single new customer. The ITC recovery covers accounting fees for three years. She discontinues one loss-leading SKU and raises the shipping threshold to $75.
For Amazon sellers in the GTA dealing with similar gaps, bookkeeping for Amazon sellers in Toronto covers exactly this kind of cleanup.
- Read More: “Why Most Amazon Sellers Fail“
What Metrics Should You Track Weekly to Improve Ecommerce Profit?
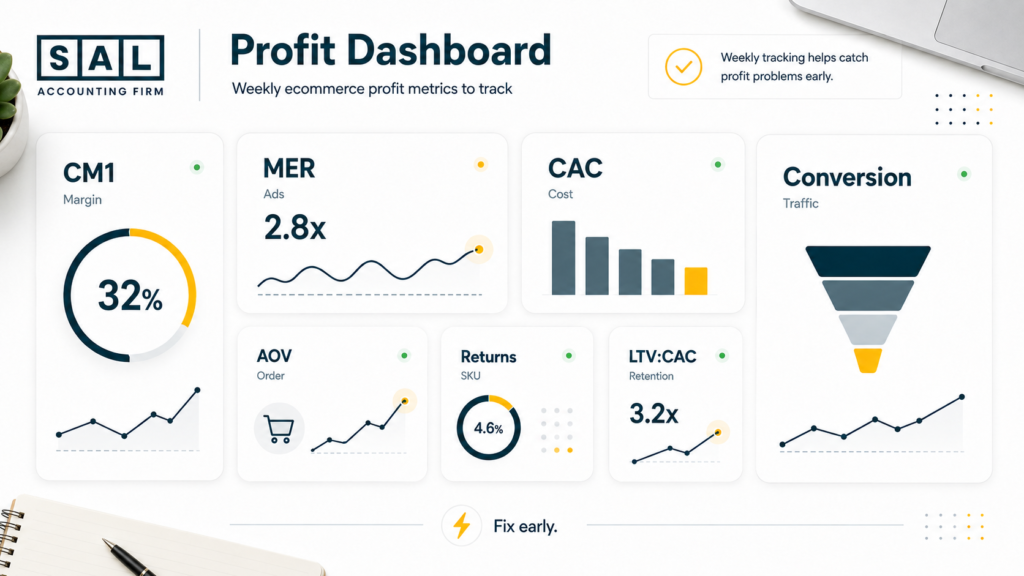
You don’t need a complex dashboard. You need seven numbers, checked on a consistent schedule, that tell you exactly where to look next.
| Metric | Where to Find It | Frequency | Action Trigger |
| CM1 by Product | Accounting software | Weekly | Below 25% → investigate |
| MER (blended) | Revenue ÷ ad spend | Weekly | Below 3 → reduce spend |
| CAC by Channel | Ad platform data | Weekly | Above 33% of LTV → pause |
| Conversion Rate | Shopify Analytics | Weekly | Below 1.5% → CRO before scaling |
| AOV | Shopify Analytics | Weekly | Declining → test bundles |
| Return Rate | Shopify / Amazon | Weekly | Above 10% → audit by SKU |
| LTV:CAC | CRM or manual | Monthly | Below 3:1 → invest in retention |
The Shopify cash flow statement is where these numbers ultimately land. The Shopify month-end close checklist is worth keeping nearby if you’re managing this without a dedicated bookkeeper.
What Does Proper Ecommerce Accounting Actually Look Like?
Standard bookkeeping records what hits your bank. Ecommerce accounting tracks gross sales separately from fees, refunds, returns, shipping adjustments, and tax, because that’s where the real business data lives. Most generalist bookkeepers miss this layer entirely. On a monthly basis, proper ecommerce accounting means:
- Recording gross revenue, not payouts
- Categorizing platform fees, processing, and fulfillment as separate line items, not lumped into COGS
- Reconciling monthly, not annually
- Tracking GST/HST collected vs. remitted separately
- Claiming all available ITCs on imports — the GST/HST Refund Calculator gives you a starting estimate
- Tracking US nexus by state — state rules govern, and the IRS provides useful background on sales and use tax
The ecommerce accounting best practices guide covers the full setup, including how A2X for Shopify can automate the reconciliation layer entirely.
If the books are getting hard to manage across multiple platforms, ecommerce bookkeeping in Toronto is worth looking at.
- Also Read: “In-House vs. Outsourced Ecommerce Accounting“
Should You Prioritize DTC or Marketplaces for Ecommerce Profitability?
Shopify and Amazon serve different functions in your profitability model — and treating them the same is one of the more expensive mistakes Canadian sellers make.
Amazon is where customers find you:
- CAC is lower because the traffic is built in
- Amazon collects sales tax in most US states
- Trade-off: margin runs 30–50% after fees
- You never own the customer data
Shopify is where you build the business:
- Gross margins run 50–70%
- You control the customer relationship
- Repeat purchase becomes your growth lever
- Trade-off: you fund all traffic and manage your own tax obligations
The Shopify vs. Amazon FBA comparison goes deeper on fee structures and payout timing. If you’re thinking about formalizing US operations, the US LLC decision tool for Shopify sellers shows whether the structure makes financial sense at your current revenue level.
Still Making Sales But Not Seeing the Profit?
Making sales is easy to see. Understanding what happened to the money after fees, shipping, returns, and tax is where most stores lose the thread. Most of the time, the gap isn’t a marketing problem or a product problem. It’s a numbers problem — and it usually starts with books that aren’t structured to show you what’s actually happening at the unit level.
If your revenue and your bank balance are telling different stories, get in touch with our team and we’ll tell you exactly what’s going wrong and what to fix first.