Your best-selling product can still be one of the weakest in your catalog. An ecommerce product profitability test looks past sales and asks what each SKU leaves after landed cost, fees, fulfilment, returns, discounts, and ads.
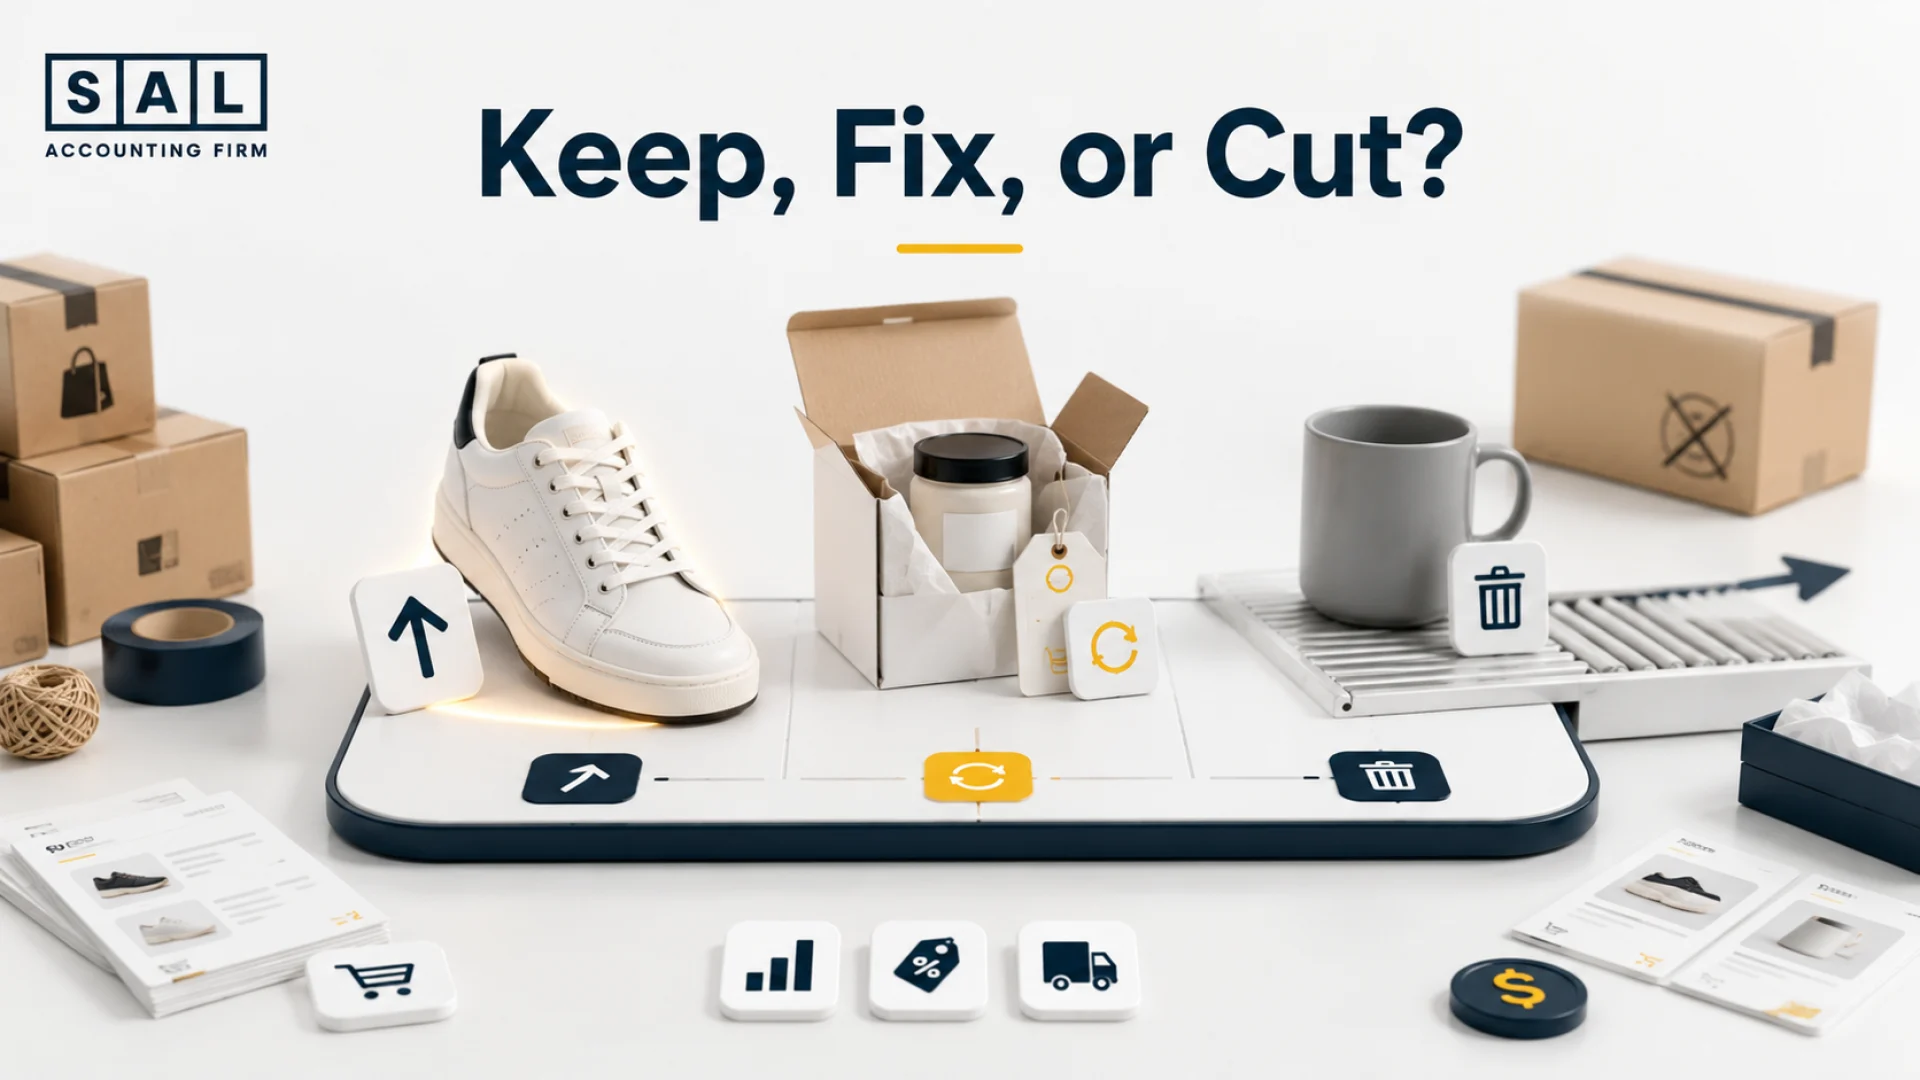
At SAL Accounting, we use that full picture to decide whether a product should be kept, fixed, or cut. Before your next reorder or ad push, make sure the product getting more cash has actually earned it.
Quick Takeaways
- High sales do not automatically mean high product profitability.
- Start with contribution margin, not revenue alone.
- Include landed COGS, fulfilment, fees, shipping, returns, discounts, and advertising.
- A weak product does not automatically belong in Cut. Sometimes one fix changes the whole picture.
- Before discontinuing a SKU, separate costs that genuinely disappear from shared overhead that stays.
- Review product profitability before major reorders, promotions, and ad-budget increases.
- The final question is simple: Does this product deserve another dollar of your cash?
What Does It Mean for an Ecommerce Product to Be Profitable?
A profitable ecommerce product leaves enough money after the costs tied to selling it to contribute toward the rest of the business. Sounds simple. The tricky part is deciding what those costs actually are.
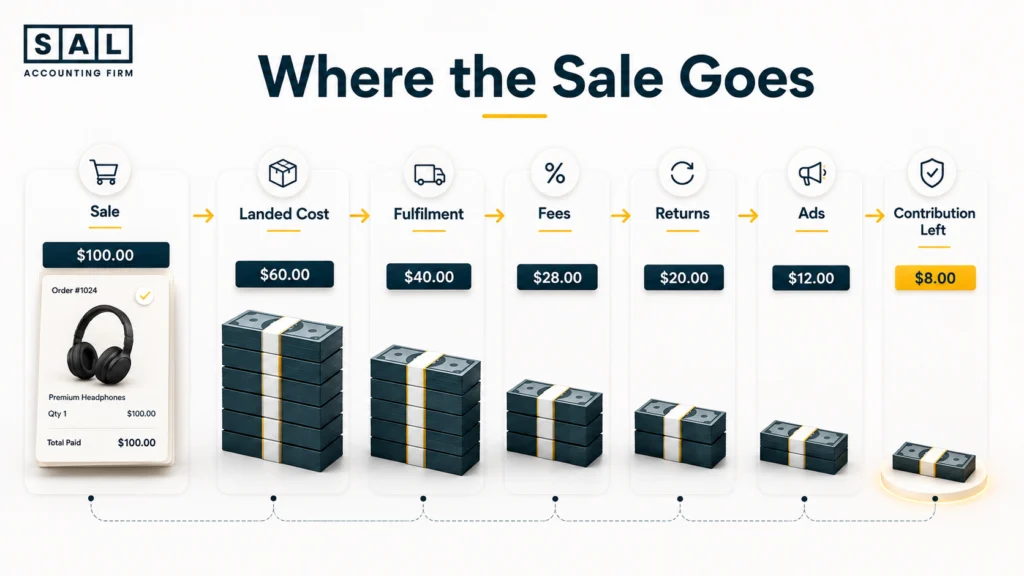
Let’s say a Canadian Shopify brand sells a premium desk lamp for C$129. The supplier charges C$38, so the founder initially sees C$91 between cost and selling price.
It looks great. Then the rest of the sale shows up:
- C$9 of inbound freight and duty allocated to the unit
- C$13 of fulfilment and outbound shipping
- C$5 of platform and payment fees
- C$7 average discount impact
- C$8 average return cost
- C$29 of advertising
Now the picture is very different.
That is why contribution margin is more useful than sales alone when you are deciding which products deserve more investment. In managerial accounting, contribution margin is the amount left after variable costs, which then contributes toward fixed costs and profit. OpenStax’s contribution margin explanation covers the same basic idea.
In simple terms:
Contribution margin = Net product revenue − variable costs tied to selling that product
Sales tell you what customers bought. Contribution tells you what the sale actually left behind.
Which Numbers Decide Whether You Keep, Fix, or Cut a Product?
You do not need a massive SKU dashboard to make a useful first decision. Start with the numbers that actually change the answer.
| Metric | What to Check | Warning Sign | Decision |
|---|---|---|---|
| Contribution margin | Money left per sale | Near zero or negative | Fix / Cut |
| Returns | Refund + return cost | One SKU unusually high | Fix |
| Advertising | Margin after acquisition | Ads consume most margin | Fix |
| Inventory | Margin + sales speed | Slow and low-margin | Cut |
| Avoidable costs | Costs lost with SKU | Higher than contribution | Cut |
Contribution Margin per Product
For an ecommerce business, the calculation may include:
- Net product sales
- Landed COGS
- Payment or marketplace fees
- Fulfilment
- Packaging
- Outbound shipping
- Discounts
- Returns
- Chargebacks
- Product-level advertising
Shopify does provide product-level gross-profit reporting when product-cost information is available. Its Gross profit by product report only includes variants that had product-cost information recorded at the time of sale. That makes Shopify useful as a starting point, but not necessarily the final Keep, Fix, or Cut calculation. Shopify’s profit-report documentation explains what those reports contain.
Your ad platform knows acquisition cost. Your fulfilment provider knows pick-and-pack and shipping. Your supplier and freight records know product cost. Your books should bring those pieces together.
Pro Tip: Calculate contribution before advertising and after advertising. If the SKU looks healthy before ads but weak after them, you may have an acquisition problem rather than a product problem.
Before blaming the SKU, calculate the Shopify fees coming off each order. SAL’s calculator is designed around Shopify plan, transaction, payment, and applicable international-card fees.
Returns and Chargebacks
A refund is not always the full cost of a return. You may also lose money through:
- Return shipping
- Warehouse handling
- Inspection
- Replacement fulfilment
- Damaged packaging
- Customer support
- Payment costs
- Stock that cannot be resold at full price
This is where a product can look great at checkout and average once the full order lifecycle is finished.
For a newer SKU, be especially careful. You may already have this month’s sales, while some of the returns tied to those sales have not happened yet.
Until enough real data builds up, use a reasonable return allowance based on similar products.
Landed Cost, Not Just the Supplier Invoice
Another common profitability problem starts with using the supplier price as the full product cost.
For products you import, freight and other costs involved in getting inventory ready for resale can change the picture.
CRA guidance says the cost of goods purchased for resale can include delivery, freight, and express charges. Inventory is also used in calculating cost of goods sold and business income. CRA’s inventory and COGS guidance is a useful reference here.
So a unit bought for C$26 might cost significantly more by the time it is sitting in your warehouse ready to sell. Use the real cost when comparing products.

Case Study: How Maya in Leslieville, Toronto Fixes a Bestseller Instead of Cutting It1
Maya runs a growing Shopify skincare brand from Leslieville, Toronto. Her bestselling bundle gets the most orders, the biggest supplier reorders, and a large share of her Meta budget. Sales keep climbing, so putting even more money behind it feels obvious. But there is a problem: cash is not improving at the same pace. The bundle also gets regular promotional discounts, ships free, and has more returns than several smaller products.
The Problem
Once landed COGS, fulfilment, free shipping, Shopify fees, discounts, returns, and advertising are separated, the margin is much thinner than Maya expected. But one number changes the decision: the bundle still produces healthy contribution before advertising.
What We Do
We would separate product economics from acquisition economics. That means comparing contribution before ads, contribution after ads, discounting, shipping, return reasons, and advertising against Maya’s other products. The first job is not to remove the bestseller. It is to find where its margin disappears.
Result
The bundle belongs in Fix, not Cut. Maya keeps it but stops using sales volume alone to decide where more ad budget goes. The next tests focus on advertising efficiency, discounting, product information, and average order value.
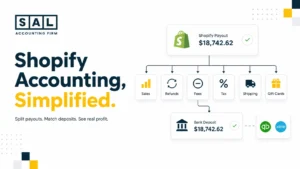
Shopify sales growing faster than your confidence in the numbers? Bring your sales, fees, refunds, inventory, and payouts into one Shopify accounting view before scaling the next SKU. SAL’s Shopify accounting page specifically covers payout reconciliation, fees, refunds, chargebacks, product margins, inventory, and monthly reporting.
What Overhead Should a Product Actually Carry?
This is where a product that is still useful can accidentally get cut. Imagine Product A generates positive contribution. Your report then allocates part of these expenses to it:
- Office rent
- General management salaries
- Accounting software
- Insurance
- Shared warehouse expenses
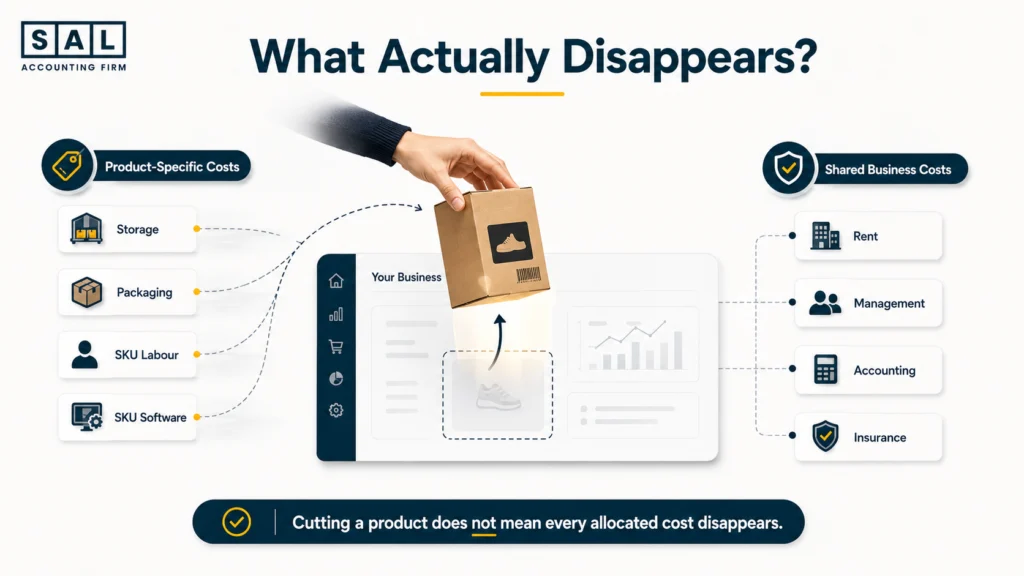
After those allocations, Product A shows a loss. So you discontinue it. But the rent stays. Management stays. The software stays. Most of the warehouse bill stays.
You have removed the product’s contribution without removing the costs that made it look unprofitable. For a Keep, Fix, or Cut decision, ask:
Which costs genuinely disappear when this SKU disappears?
This is a standard issue in keep-or-discontinue analysis. A product may have positive contribution but appear unprofitable after common fixed costs are allocated to it. The relevant comparison is the revenue and costs that actually change between keeping and eliminating the product.
That means separating costs such as dedicated storage, product-specific packaging, unique software, or product-specific labour from general costs you will pay anyway.
Pro Tip: Put this question beside every overhead line before you cut a product: “Do I genuinely stop paying this if the SKU goes?” If the answer is no, do not pretend the full amount is a saving.
Where Do Your Product Profitability Numbers Come From?
The formula is usually not the hardest part. Getting several systems to tell the same story is. A typical product profitability review may pull from:
- Shopify or Amazon: sales, units, discounts, refunds, product data
- Supplier records: purchase price
- Freight and customs records: landed inventory costs
- 3PL, FBA, or carrier reports: fulfilment, storage, packaging, shipping
- Payment processors: transaction fees
- Meta, Google, or Amazon Ads: acquisition spend
- Accounting records: inventory, expenses, payouts, and the final tie-out
That is also why recording the bank deposit as product revenue causes problems. Your payout is the end of several movements, not the full story of what happened to the order.
Running Shopify, Amazon, or several payment channels together? Put them into one monthly ecommerce bookkeeping picture so you are not comparing SKUs against numbers that never reconciled in the first place. SAL’s ecommerce bookkeeping service covers monthly payout reconciliation, inventory and COGS, marketplace fees, and related reporting.
Amazon sellers have another layer because settlement reports, FBA fees, inventory, and payouts need to be separated properly. Clean up the Amazon side before ranking your SKUs.
For the measurement side in more detail, read “Ecommerce SKU Profitability Analysis: What to Expect From Your Accountant”. This post focuses on the decision that comes next: what do you do with the product once you know the numbers?
A Real Product Profitability Example: What Happens When Ads Get Expensive?
Let’s walk through another product. A Canadian Shopify store sells a premium weekender bag. After normal discounts and refunds, average net product revenue is C$148. The supplier invoice is only C$44. At first glance, that looks fantastic. Then the full cost stack arrives.
| Step | Cost | Amount Left | What It Shows |
|---|---|---|---|
| Net product revenue | — | $148 | Starting point |
| Landed COGS | $51 | $97 | Real inventory cost |
| Fulfilment + fees | $19 | $78 | Selling cost |
| Return allowance | $9 | $69 | Post-sale effect |
| Advertising | $36 | $33 | Final contribution |
The product leaves C$33 per sale after those costs. Now imagine paid acquisition rises from C$36 to C$52. Contribution drops to C$17. Should the founder cut the weekender bag? Not yet. Before advertising, it still leaves C$69. That tells us the underlying product economics may still work. Customer acquisition is the obvious place to investigate first.
The founder could test:
- A different campaign mix
- Less discounting
- A modest price increase
- A higher free-shipping threshold
- Bundling
- More organic acquisition
- Better product information if returns are too high
Then run the numbers again. That is why Fix deserves its own category.
Weak profitability tells you there is a problem. It does not automatically tell you the product is the problem.
Once individual SKU margins are clearer, calculate your store-level EBITDA to check whether the wider business is producing healthy operating earnings beyond the performance of one product.
The Keep, Fix, or Cut Product Profitability Framework
Once the source numbers are reliable, every important product should land in one of three buckets.
| Decision | What You’re Seeing | Next Move | Example |
|---|---|---|---|
| Keep | Healthy contribution | Protect and scale | Good margin + demand |
| Fix | Core SKU works, one cost does not | Test weak point | High ad cost |
| Cut | Weak after realistic fixes | Reduce or stop | Low margin + slow sales |
When Should You Keep a Product?
Keep it when the economics work and it is using your cash well. Typical signs include:
- Healthy contribution margin
- Stable demand
- Manageable returns
- Reasonable acquisition cost
- Good inventory movement
- Strong total contribution dollars
- A useful role in bundles, upsells, or repeat orders
One important point: do not rank products only by margin percentage.
Product A might contribute C$16 per unit and sell 5,000 units.
Product B might contribute C$32 per unit but sell only 250.
Product B has the higher contribution per unit. Product A may still put substantially more total dollars into the business.
Look at margin percentage and total contribution dollars together.
When Should You Fix a Product?
Put the SKU in Fix when the core economics work but one part of the sale is dragging the result down. For example:
- Healthy before ads, weak after ads
- Good margin, high returns
- Strong demand, expensive fulfilment
- Good full-price economics, heavy discount dependence
- Rising supplier or freight costs
- Strong Canadian economics, weak U.S. economics
- Healthy contribution but slow inventory movement
Now you have something specific to work on. Raise the price. Reduce the discount. Renegotiate freight. Change packaging. Adjust advertising. Improve the product page. Reduce the next purchase order. Then test again.
Pro Tip: Change one major lever at a time when you can. If you change price, shipping, ads, and discounting together, the result may improve without telling you what actually fixed it.
When Should You Cut a Product?
A product becomes a stronger Cut candidate when the numbers remain weak after reasonable fixes have already been tried. Look for combinations such as:
- Consistently negative or very weak contribution
- No realistic pricing fix
- High returns
- Slow sales
- Large minimum orders
- Too much cash sitting in stock
- Product-specific costs that disappear when it goes
- Stronger SKUs competing for the same inventory money
- No important role in bundles, acquisition, or repeat purchasing
Basically, the SKU keeps asking the business for more cash without giving enough back. The point is not to cut every low-margin product. It is to stop funding the ones that have run out of good reasons to stay.
Why Product Profitability Is Not a One-Time Check
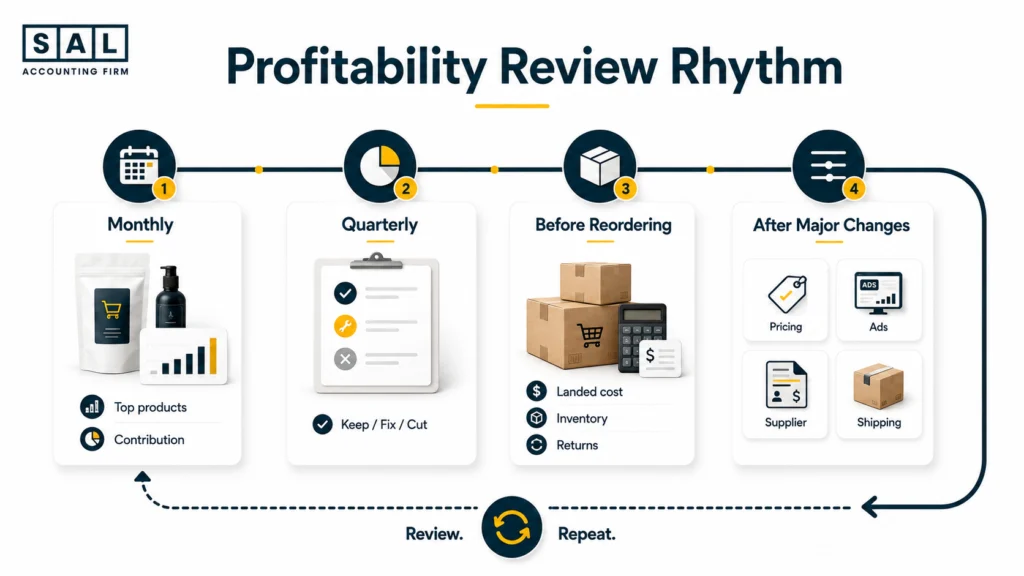
A product can move from Keep to Fix faster than you might expect. Supplier pricing can increase, freight can get more expensive, ad costs can rise, and heavier discounting can slowly eat into the margin. Returns may also creep up, currency movements can change landed costs, or your fulfilment provider may introduce new pricing. Basically, the numbers that made a product profitable six months ago may not reflect what is happening today. That is why it makes sense to review product profitability on a regular rhythm:
- Monthly: Review your biggest revenue and contribution SKUs.
- Quarterly: Run a broader Keep, Fix, or Cut review.
- Before major reorders: Recheck landed cost, margin, returns, and inventory speed.
- After a significant cost change: Recalculate.
- After a pricing or ad test: Compare the new contribution with the old one.
You do not need to review every tiny variation every week. Start where the money is.
What Does It Cost You to Keep Guessing?
The cost of keeping the wrong product goes beyond that SKU’s margin. Imagine you keep reordering a product because it generates a lot of revenue. Meanwhile:
- It requires heavy advertising
- Inventory turns slowly
- Returns are high
- It consumes warehouse space
- The supplier wants large purchase orders
- Your stronger products keep running short because cash is tied up elsewhere
Now the weak product is influencing decisions across the business. That is why profit, inventory, and cash need to be read together rather than one at a time.
- Also read: “Ecommerce Profit vs. Cash Flow: Why They Don’t Match”
Before your next purchase order, ask:
- What does this product actually contribute?
- How quickly does it turn back into cash?
- Could the same inventory dollar earn more in another SKU?
- Is the weak point realistically fixable?
- What costs actually disappear if we stop selling it?
At the end of the day, every product is competing for your next dollar of inventory, advertising, and attention.
Case Study: How Daniel in Port Credit, Mississauga Knows When It’s Time to Cut2
Daniel runs a home and kitchen ecommerce brand from Port Credit, Mississauga. One oversized ceramic serving set has a premium selling price and looks great in product photography, so it has stayed in the catalog for years. But it moves slowly, costs more to ship than smaller products, occasionally arrives damaged, takes extra warehouse space, and requires a large cash commitment every time the supplier asks for another minimum order.
The Problem
The high selling price makes the serving set look attractive at first. Once Daniel includes landed cost, oversized fulfilment, damaged inventory, replacement shipments, discounts, payment fees, and the impact of slow stock, very little contribution remains. A higher selling price has already been tested, and demand becomes even weaker.
What We Do
We would compare three paths: reorder normally, reduce the inventory commitment and reposition the product, or discontinue it. Shared warehouse and management costs would stay out of the projected savings unless those expenses actually disappear with the SKU.
Result
The serving set moves into Cut. Daniel sells through the remaining inventory instead of committing cash to another large reorder. That money can now move into faster-selling products with healthier contribution and lower damage rates.
The product is not being removed because nobody likes it. It is being removed because the same cash has a better job somewhere else.
What If the Same Product Is Sold Into the U.S.?
Canadian ecommerce founders should also be careful about looking at a product as though it has one margin everywhere.
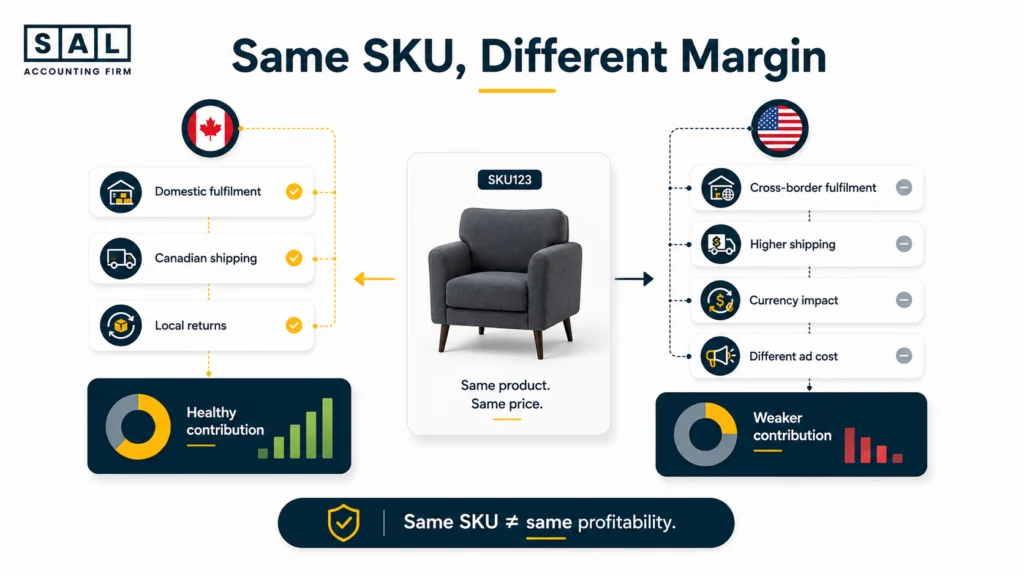
The same SKU may have very different economics between Canada and the U.S. because shipping, fulfilment, returns, fees, currency, and acquisition costs can change by market.
A product might belong in Keep in Canada and Fix in the U.S.
That is a much better conclusion than cutting the SKU everywhere.
Once U.S. sales become meaningful, sales tax becomes a separate question from product margin. SAL’s nexus checker compares annual U.S. sales against state-level screening thresholds and explicitly notes that the tool is a screening tool rather than professional tax advice. Screen your state-by-state nexus exposure before a growing U.S. product line creates another blind spot.
- Read more: “Import vs Export Guide for Canadian Ecommerce Brands”
Turn the Test Into a Repeatable Decision
You do not need another spreadsheet telling you Product A made more sales than Product B. You need an answer you can act on.
KEEP: These products have healthy economics and deserve sensible investment.
FIX: These products still have potential, but you know exactly what needs attention.
CUT: These products have stopped earning the cash, inventory space, and attention they consume.
That is also where the funnel should get simpler. The free tools give you a first check. Your accounting gives you trustworthy source numbers.
A Product Profitability Review turns those numbers into Keep, Fix, or Cut decisions.
Then, when the catalog changes again, your ongoing ecommerce accounting keeps the decision from becoming another once-a-year spreadsheet exercise.
Know Which Products Are Actually Making You Money
You do not need to cut more products. You need to stop guessing which ones deserve more investment.
SAL’s Product Profitability Review brings sales, landed costs, fees, fulfilment, returns, advertising, inventory, and relevant overhead into one decision so you can understand what to keep, what to repair, and what no longer deserves another reorder.
Bring the SKUs you are most unsure about when you book a consultation with SAL Accounting. The goal is simple: put your next dollar behind the product that has actually earned it.