
Management reporting turns your sales, bookkeeping, inventory, marketing, and cash data into clear decisions about profit, pricing, stock, and growth. At SAL Accounting, we use it to help Canadian ecommerce founders understand what happened, why it happened, and what needs attention next. A
strong sales month can still hide shrinking margins or a cash gap. Read this before your next campaign, purchase order, or hire. The number you miss this month could become next quarter’s expensive problem.
Need reliable books before you build better reports? See how SAL approaches ecommerce accounting and bookkeeping for growing online stores.
Quick Takeaways
- Management reporting explains what changed, why it changed, and what to do next.
- Financial statements provide the accounting foundation, but they may not explain products, channels, campaigns, or operational problems.
- Ecommerce dashboards are useful for monitoring activity, but they do not show the complete profit or cash picture.
- Most growing ecommerce businesses should review a complete management reporting package monthly.
- A useful report should end with clear actions, owners, and deadlines—not just pages of numbers.
Get a quick baseline: Check your core operating performance with SAL’s Ecommerce EBITDA Calculator. It’s a useful starting estimate, not a replacement for reconciled monthly reports.
What Is Ecommerce Management Reporting?
Ecommerce management reporting is the recurring process of turning financial and operational data into reports that help founders understand performance, identify problems, plan ahead, and make better decisions.
The important word here is management.
These reports are built mainly for you and your leadership team. They are not created only for year-end tax filing, the CRA, a bank, or an outside investor.
Example: Let’s say your store generated $420,000 in net sales during June, up from $376,000 in May.
That sounds like a strong month. But the sales number does not tell you that:
- Refunds increased much faster than revenue.
- Air freight added $5.40 to the landed cost of your newest product.
- Advertising spend increased by $38,000.
- A discounted bundle produced most of the additional orders.
- A large part of the money in your bank account is already committed to inventory, tax, payroll, and supplier payments.
The store grew. But did it become more profitable? Did it generate more available cash? Should you scale the campaign or fix the offer first?
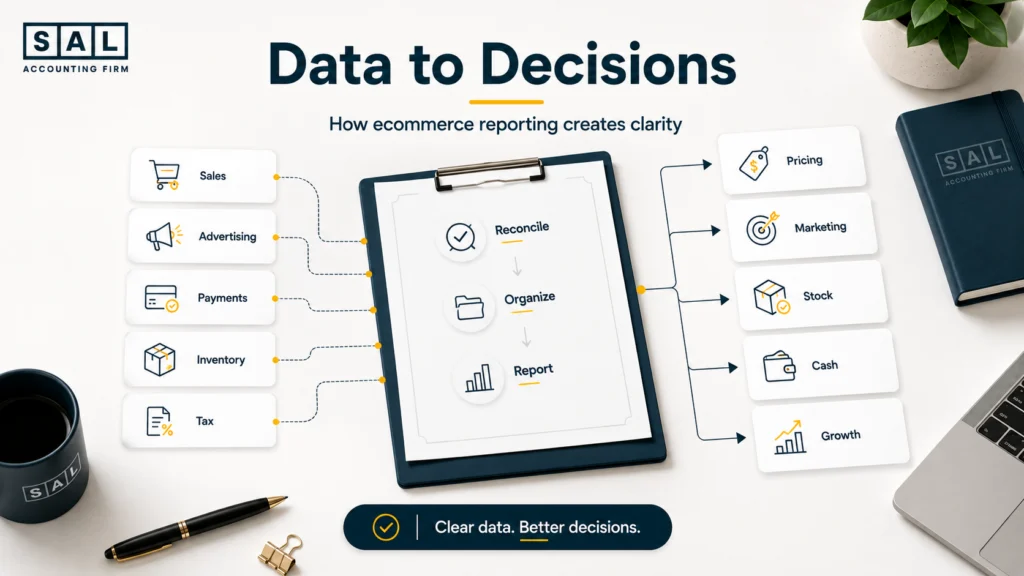
That is what management reporting should tell you. A useful ecommerce management package brings together:
- Shopify, Amazon, and other marketplace sales
- Discounts, refunds, returns, and chargebacks
- Payment and platform fees
- Inventory and landed product costs
- Fulfilment and shipping expenses
- Advertising spend
- Cash commitments
- Sales and income tax balances
- Budgets and forecasts
- Product and channel performance
BDC separates management reports from financial statements and forecasts because each serves a different audience. Its guide to financial reports for entrepreneurs describes management reports as detailed internal reports that may break expenses or results into individual products, business lines, regions, or marketing channels.
At a minimum, your monthly reports should answer five questions:
- What happened?
- Why did it happen?
- How did the result compare with the budget or an earlier period?
- What is likely to happen next?
- What should the business do about it?
Basically, bookkeeping records the activity.
Management reporting explains what that activity means.
Management Reports vs. Financial Statements vs. Dashboards
Management reports, financial statements, and ecommerce dashboards may use some of the same data, but they do not have the same job.
| Report | What It Shows | Best Used For | Main Limitation |
|---|---|---|---|
| Management report | Results, causes, forecasts, risks, and actions | Monthly business decisions | Depends on complete underlying records |
| Financial statements | Revenue, expenses, assets, liabilities, equity, and cash flow | Overall financial performance and formal reporting | May not explain product or channel changes |
| Ecommerce dashboard | Sales, orders, traffic, conversion, and fulfilment activity | Daily or weekly monitoring | Does not replace reconciled accounting or forecasting |
A simple way to think about it is:
- Financial statements show what happened financially.
- A dashboard shows what appears to be happening operationally.
- Management reporting explains why it happened and what to do next.
How It’s Different From Your Financial Statements
Your financial statements are the accounting foundation of the reporting package. They normally include:
- An income statement or profit and loss statement
- A balance sheet
- A cash flow statement
- A statement of retained earnings or changes in equity
BDC identifies these as the four major financial statements used to understand a business’s performance and financial position. Your income statement might show:
- Net sales: $468,000
- Cost of goods sold: $192,000
- Gross profit: $276,000
- Operating expenses: $251,000
- Net income: $25,000
That tells you the company made $25,000. It may not tell you:
- Which SKU produced most of that profit
- Whether Shopify or Amazon generated the better margin
- Why returns increased
- Whether a supplier price change reduced profitability
- Whether the U.S. channel remained profitable after currency and fulfilment costs
- Whether the next purchase order will leave enough operating cash
- Which campaign should be increased, reduced, or stopped
Management reporting takes the company-wide result and breaks it into the parts you can actually manage. It does not replace your financial statements. It makes them more useful.
How It’s Different From a Dashboard
A dashboard is designed for fast monitoring.
The Shopify Analytics overview dashboard displays metrics such as sales, sessions, and fulfilment information, with data generally updated within about one minute. That makes it useful for seeing what is happening in the store right now. For example, your dashboard may show that:
- Sales are up today.
- Conversion has fallen.
- One product is receiving more orders.
- A campaign has increased traffic.
- Fulfilment times are getting longer.
But the dashboard does not, by itself, confirm that:
- Every payout has been reconciled.
- Refunds are recorded in the correct month.
- Sales tax has been separated from revenue.
- Landed costs include freight, duties, and brokerage.
- Supplier invoices are complete.
- Foreign-currency balances are adjusted.
- Cash has been reserved for inventory and tax.
- A high-revenue product is profitable after advertising and fulfilment.
The dashboard may be right. It is simply answering a different question.
- Need clearer Shopify numbers? Get Shopify accounting that shows what your store actually keeps.
What’s Actually Inside a Monthly Reporting Package?
A good monthly reporting package gives you enough detail to understand the business without burying you in data.
There is no single template that works for every ecommerce company. A Shopify store with 15 products does not need the same package as a business selling through Shopify, Amazon, wholesale, and multiple countries.
The report should be built around the decisions you regularly make.
| Reporting Section | What You See | Ecommerce Detail | Decision It Supports |
|---|---|---|---|
| Executive summary | Main results, risks, and priorities | Product, channel, margin, and cash changes | What needs attention first? |
| Financial results | Revenue, gross profit, expenses, and net income | Fees, refunds, fulfilment, advertising, and COGS | Is growth producing profit? |
| Cash and forecast | Available cash and upcoming commitments | Inventory, tax, payroll, debt, and ad payments | What can the business afford? |
| Product and channel performance | Profit by SKU, collection, platform, or country | Landed costs, returns, discounts, fees, and ads | What should be scaled or fixed? |
| Action plan | Recommendations, owners, and deadlines | Pricing, inventory, campaign, or reporting changes | What happens next? |
The package should be built after the month is properly closed. That normally means confirming:
- Bank and credit card balances
- Shopify and Amazon payouts
- PayPal, Stripe, and other payment activity
- Refunds and chargebacks
- Inventory and cost of goods sold
- Supplier invoices
- Sales tax balances
- Payroll and operating expenses
- Loans and financing
- Foreign-currency accounts
Without those steps, the report may look polished while still giving you the wrong answer.
A structured Shopify month-end close process keeps the reporting package from being built on incomplete platform and accounting data.
- Get your records organized: Use SAL’s Tax Document Checklist for Ecommerce Stores before the reporting or tax work begins.
The Executive Financial Summary
The executive summary should be the first page. You should be able to read it in a few minutes and understand:
- Whether revenue was above or below plan
- Whether gross and contribution margins improved
- Whether operating profit increased
- How much cash is genuinely available
- Which product or channel changed most
- What the biggest financial risk is
- Which decisions need to be made now
A useful summary might say:
Net sales finished 8% above budget, but operating profit was 31% below plan. The main causes were higher returns on the new travel collection, expedited inbound freight, and advertising spend that increased faster than contribution profit. Closing cash was $196,000, but only $43,000 remained uncommitted after inventory deposits, tax, payroll, and debt payments.
That gives the founder something to act on.
“Sales were strong this month” does not.
The summary should also compare the month against useful benchmarks.
For a seasonal brand, comparing July only with June may be misleading. Comparing July this year with July last year may show whether the business is genuinely improving.
Pro tip: Compare actual results with both the budget and the same period last year. Add the previous month only when it makes the trend clearer.
Your tax reserve should also appear in the cash discussion. Money sitting in the bank is not fully available if part of it will be needed for corporate tax.
- Plan the reserve before spending the cash: Estimate your Canadian corporate income tax with SAL’s Corporate Income Tax Calculator.

The Commentary Behind the Numbers
Commentary is what turns a financial report into a management tool.
For every important change, it should explain:
- What changed
- Why it changed
- What the change affects
- What action is recommended
- Who owns the action
- When it should be completed
For example:
Gross margin fell from 61.2% to 57.8%. Product purchase prices were stable, but expedited inbound freight added $5.60 per unit to the new collection. At the current selling price, the collection no longer reaches its contribution-margin target. Review pricing before the next campaign and return the following order to sea freight. Owner: operations lead. Due: August 18.
Now the founder knows what happened and what to do next.
This is especially important when product costs change. If unit cost excludes freight, duties, brokerage, or product preparation, the report can make a weak product look healthy. A proper inventory landed cost accounting process gives the reporting team a more reliable starting point.
The same applies to product-level performance. Revenue by SKU is not enough. An ecommerce SKU profitability analysis should consider landed cost, discounts, returns, fees, fulfilment, shipping, and advertising before identifying a product as a winner.
- Check what the platform is taking: Run your sales volume through SAL’s Shopify Fee Calculator.
Pro tip: Do not explain every small movement. Focus the commentary on changes large enough to affect a decision.
Case Study: How Nadia in The Junction, Toronto Found the Margin Leak Behind Record Sales1
Nadia runs a direct-to-consumer apparel brand from The Junction, Toronto. Her Shopify sales had increased steadily, and a growing wholesale channel made the company look stronger than ever. Several months had broken revenue records. Still, the bank balance changed unpredictably, and Nadia could not explain why a busy month sometimes left less cash than a slower one. Her accountant sent a monthly profit and loss statement, but it did not separate collections, channels, returns, or advertising performance.
The Problem
The company-wide income statement blended high-margin core products with a newer collection that had heavy discounts, expensive fulfilment, and a much higher return rate. Because the collection generated substantial revenue, Nadia assumed it was one of her strongest performers. In reality, it was tying up inventory cash and producing very little contribution profit.
What We Do
We reconcile Shopify sales and payouts, review landed product costs, and separate direct-to-consumer and wholesale performance. The monthly package shows gross margin and contribution profit by collection, return rates, advertising spend, open purchase orders, tax commitments, and a short-term cash forecast. Written commentary explains the main changes and assigns each recommendation to a responsible person.
Result
The reporting shows that the new collection produces 32% of monthly sales but nearly half of all product returns. Nadia reduces the next purchase order, improves the sizing information on the product pages, and shifts part of the advertising budget toward two higher-margin bundles. Over the following reporting cycles, contribution profit improves even though revenue remains relatively stable. The goal was not simply to sell more. It was to keep more from the sales the business already had.
How Often Should You Receive Management Reports?
The reporting frequency should match the speed of the decision.
You may need sales and fulfilment information today. Product profitability usually needs a completed month. Hiring, financing, inventory strategy, and expansion decisions require a wider view.
| Reporting Level | Frequency | What to Review | Main Purpose |
|---|---|---|---|
| Daily flash report | Daily when needed | Sales, refunds, ad spend, stockouts, and fulfilment | Catch immediate issues |
| Operating review | Weekly | Sales pace, campaigns, inventory, and operations | Keep teams aligned |
| Management report | Monthly | Profit, cash, margins, inventory, forecasts, and actions | Make financial decisions |
| Strategic review | Quarterly or annually | Trends, funding, hiring, channels, tax, and long-term plans | Adjust the bigger direction |
Daily Flash Reports
A daily flash report should be short. It is not a finalized profit report. It is an early-warning system. Depending on the business, it may show:
- Gross and net sales
- Order volume
- Average order value
- Refunds and cancellations
- Advertising spend
- Payment failures
- Chargebacks
- Fulfilment delays
- Stockouts
- Unusual changes from the prior period
A smaller or more stable store may not need a formal report every day. A high-volume business, an Amazon seller with changing inventory levels, or a brand running a major promotion may need one.
The point is to catch exceptions, not close the books every morning.
For example, if sales rise 20% but payment failures suddenly triple, the team should not wait until month-end to investigate.
Monthly Reporting
Monthly reporting is the main financial decision-making rhythm for most growing ecommerce founders.
It gives the accounting team enough time to:
- Reconcile sales and payouts
- Record fees, refunds, and chargebacks
- Update inventory and cost of goods sold
- Record supplier and operating expenses
- Reconcile bank and credit card accounts
- Review tax balances
- Prepare financial statements
- Compare results with the budget
- Update the cash forecast
- Write useful commentary
The report should be reviewed while the events behind the numbers are still recent.
A monthly review meeting does not need to become a three-hour accounting lecture. Focus on:
- The largest changes
- The reasons behind them
- Cash and upcoming commitments
- Decisions that need approval
- Actions, owners, and deadlines
At the end of the meeting, everyone should know what they are responsible for next.
Pro tip: Keep a running action log from one meeting to the next. A recommendation without an owner or deadline is not an action plan.
Annual Reporting
Annual reporting gives you the complete fiscal-year picture.
It is important for:
- Corporate tax filing
- Shareholder reporting
- Year-over-year analysis
- Financing applications
- Business valuation
- Ownership planning
- Long-term strategy
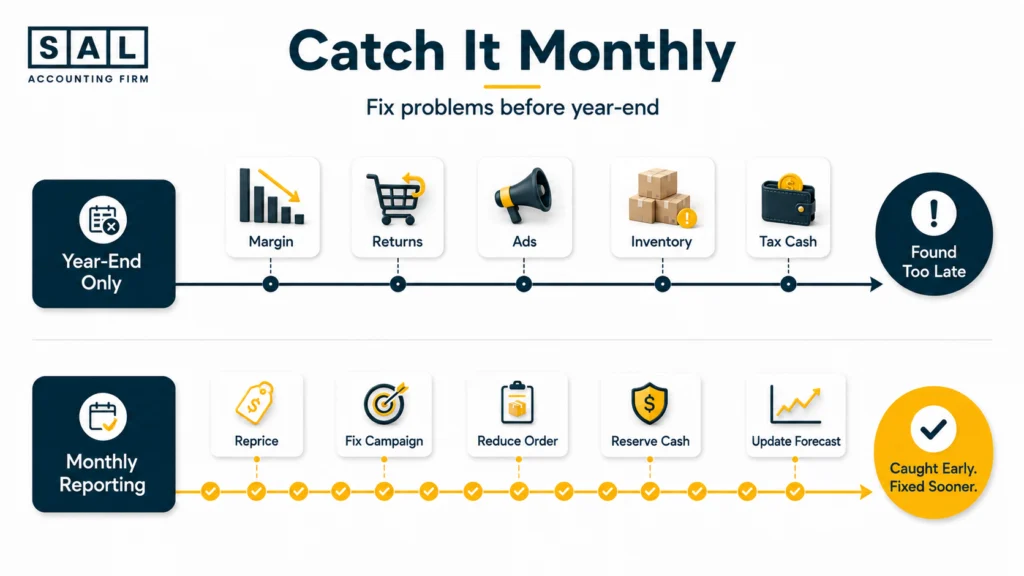
But annual reporting is too slow to manage an ecommerce business by itself.
Finding out after year-end that a SKU lost money for nine months does not give you a chance to fix those nine months.
The same applies to:
- Advertising overspend
- Inventory buildup
- Unreconciled payouts
- Sales tax exposure
- An unprofitable channel
- A growing cash gap
Annual reports tell you where the business finished.
Monthly reports give you time to change where it is going.
Why This Matters More as Your Ecommerce Business Grows
You do not need to reach one specific revenue number before management reporting becomes useful.
The real trigger is complexity.
A $500,000 store with 70 SKUs, three payment processors, U.S. sales, and large seasonal purchase orders may need more reporting than a larger business with one simple revenue stream.
Your reporting needs usually increase when you add:
- More products or collections
- Shopify, Amazon, wholesale, or retail channels
- Larger advertising budgets
- Multiple warehouses or fulfilment partners
- Bigger inventory commitments
- Employees and department managers
- Canadian and U.S. sales
- Foreign-currency accounts
- Loans or other financing
- Investors or potential buyers
- Multiple companies or entities
Each layer creates another place where sales, profit, cash, and operational data can tell different stories.
For example, the company-wide margin may look healthy while three SKUs are losing money. A growing Amazon channel may appear profitable before marketplace fees, storage charges, returns, and advertising are assigned correctly.
A strong bank balance may also disappear once open purchase orders, tax obligations, and credit card payments are considered.
That is why a growing company may need reporting by:
- Product
- Collection
- Sales channel
- Country
- Customer group
- Campaign
- Warehouse
- Entity
Cross-border growth adds another layer. Once U.S. sales become meaningful, your reports should make it easy to review revenue, costs, cash, inventory, and sales by market.
- Selling into the U.S.? Screen your state-by-state sales with SAL’s US Economic Nexus Threshold Checker, then confirm any registration or filing obligations before acting.
Entity structure is a separate decision. Opening a U.S. company does not automatically solve a reporting, tax, or profitability problem. Your management reports should first show where the sales come from, what the U.S. channel costs, and whether the expected savings support the additional complexity.
Pro tip: Do not add a KPI simply because your software can display it. Add it only when someone knows what decision it is meant to support.
When Will You Need Lender- or Investor-Ready Reports?
Your internal management package and your external funding package should come from the same reliable accounting records.
But they should not look exactly the same.
Your internal reports may contain detailed information about individual products, suppliers, campaigns, employees, and operational problems. A lender or investor normally needs a cleaner package focused on financial health, risk, future plans, and the use of funds.
Lender-Ready Reports
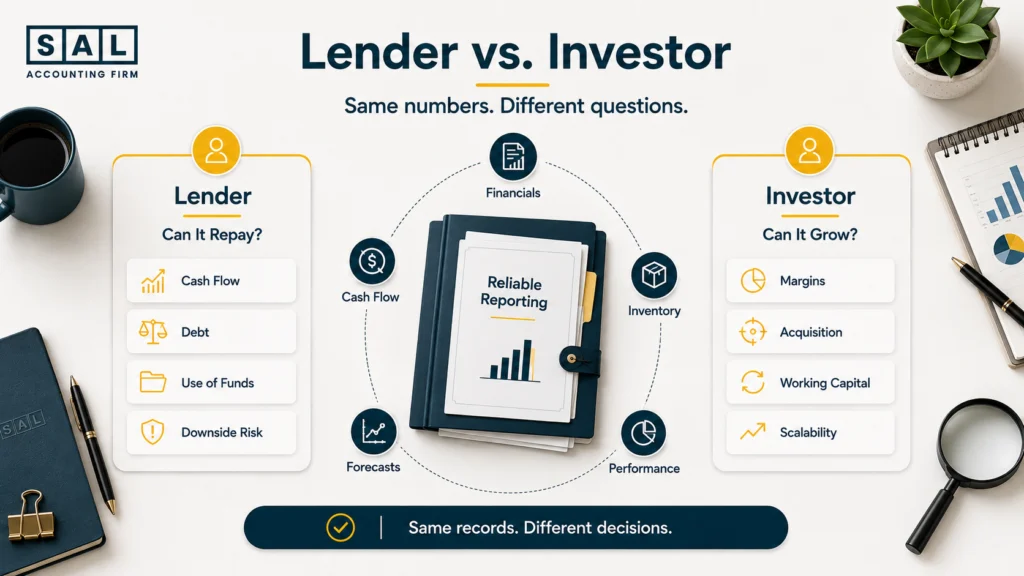
A lender is mainly trying to answer one question:
Can this business repay the money?
BDC identifies strong cash flow as the first major green light financial institutions look for when assessing a business. Lenders also review existing debt, owner investment, financial performance, and the strength of the proposed project. Its guide to how a bank evaluates a business explains these priorities in more detail.
A lender-ready package may include:
- Historical annual financial statements
- Current year-to-date statements
- Comparisons with previous periods
- A current balance sheet
- A cash flow statement
- A monthly cash forecast
- Existing debt and repayment schedules
- Inventory values and open purchase orders
- The requested financing amount
- A detailed use-of-funds breakdown
- Base and downside scenarios
- Explanations for major changes
For an ecommerce business, the lender may also need to understand why cash is tied up in inventory and how long it will take to return to the company.
Suppose you are requesting $300,000 to fund a seasonal purchase order.
The forecast should show:
- When the supplier deposit is due
- When the final payment is due
- When freight and duties will be paid
- When the inventory should arrive
- When customers are expected to buy it
- When the resulting cash should become available
- Whether the company can still cover tax, payroll, advertising, and loan payments
That is what turns an inventory request into an understandable financing plan.
Investor-Ready Reports
An investor also wants reliable historical numbers, but the questions usually go further.
Investors may examine:
- Revenue growth
- Gross and contribution margins
- Profit growth
- Customer acquisition costs
- Repeat-purchase behaviour
- Product and channel concentration
- Inventory turnover
- Working-capital requirements
- Cash generation or cash burn
- Scalability
- Forecast assumptions
- Future funding needs
- Risks tied to suppliers, platforms, or the founder
BDC explains that lenders generally focus on realistic cash-flow forecasts and repayment, while equity investors are more interested in potential upside and long-term growth.
The investor should be able to follow the story from sales to margin, margin to cash, and cash to the future plan.
That normally requires:
- Monthly historical financial statements
- Product and channel margins
- Marketing-efficiency trends
- Customer and product concentration
- Repeat-purchase information
- Inventory ageing
- Working-capital requirements
- Forecast income statements
- Forecast balance sheets
- Forecast cash flow
- Base, upside, and downside scenarios
- Clear assumptions behind the model
BDC’s financial projections guide notes that projections show bankers and investors how funds will be used, how loans may be repaid, and how the company expects to grow.
This reporting discipline is also useful when you are preparing for a future exit.
- Also read: “How to Prepare Your Shopify Business for Sale”
Case Study: How Omar in Port Credit, Mississauga Prepared for Inventory Financing2
Omar operates a home-organization brand from Port Credit, Mississauga. The business sells through Shopify and Amazon, with a large part of annual revenue arriving during the holiday season. A supplier offered a lower unit cost if Omar placed a larger order, but the deposit, final payment, and freight costs would put pressure on cash several months before the products were expected to sell. He decided to apply for financing.
The Problem
The business was profitable, but its historical statements and spreadsheet forecast did not tell the same story. Amazon reserves, inventory deposits, U.S.-dollar purchases, owner withdrawals, tax balances, and supplier payments were treated differently between the accounting system and the forecast. The lender requested current statements, cash projections, inventory information, debt details, and a clear use-of-funds explanation.
What We Do
We reconcile the historical results, update inventory and foreign-currency balances, and prepare comparative interim financial statements. We then build a monthly cash forecast showing supplier deposits, final payments, freight, expected sales, tax, payroll, advertising, and debt payments. The package includes an inventory schedule, use-of-funds summary, and base and downside scenarios.
Result
The forecast reveals that Omar’s original $350,000 request would leave the company carrying more slow-moving inventory than it needed. He changes the plan to a staged $280,000 facility tied to two purchase orders. The revised structure leaves more cash available for tax, payroll, advertising, and the slower post-holiday period. Omar enters the lender conversation with one consistent set of numbers instead of several conflicting spreadsheets.
A Real Example, Walked Through
The following numbers are illustrative, but the pattern is common.
A Canadian skincare brand finishes June with $324,000 in net sales, compared with $289,000 in May.
Sales increased by approximately 12%.
The founder opens the sales dashboard and sees a strong month.
What the Founder Sees
- Sales increased by $35,000.
- The new skincare bundle produced a large number of orders.
- Website traffic increased.
- Closing cash reached $214,000.
- The campaign brought in more first-time customers.
Based on that information, the obvious next move appears to be increasing advertising and placing a larger reorder.
What the Management Report Reveals
The completed monthly package shows that:
- Gross margin fell from 61% to 57%.
- Advertising spend increased from $59,000 to $81,000.
- The refund rate increased from 4.2% to 7.4%.
- More orders required a higher-cost fulfilment option.
- Contribution profit fell even though sales increased.
- The new bundle generated a disproportionate share of returns.
- Part of the increase in cash came from delaying a supplier payment.
Sales went up.
The amount remaining after the costs required to produce those sales went down.
This is why ecommerce contribution margin often provides a more useful decision-making view than revenue or gross profit alone.
The cash section adds another issue.
Of the $214,000 in the bank:
- $127,000 is committed to inventory.
- $35,000 is reserved for tax.
- $32,000 is needed for payroll and near-term operating expenses.
That leaves approximately $20,000 of genuinely uncommitted cash before unexpected costs.
The business is not necessarily in immediate trouble.
But it does not have the spare cash the dashboard appears to show.
What the Founder Changes
The report leads to five decisions:
- Pause the weakest campaign linked to the high-return bundle.
- Investigate whether the product, packaging, or customer expectations are causing returns.
- Review the bundle price and fulfilment method.
- Reduce the next reorder until the return issue is understood.
- Separate inventory and tax reserves from normal operating cash.
The dashboard was not wrong.
It was incomplete.
The useful conclusion is not simply:
Sales increased.
It is:
Demand increased, but the current offer is converting that demand into less contribution profit and more cash pressure. Fix the return, fulfilment, and advertising issues before scaling the campaign again.
Pro tip: Every worked example in a management meeting should finish with an action, an owner, and a date. Otherwise, the same explanation may appear in next month’s report.
What Happens Without This?
Without reliable management reporting, founders often manage the business through three incomplete signals:
- The sales dashboard
- The bank balance
- Their general feeling about whether the month was busy
None is enough on its own.

Sales Growth Gets Mistaken for Profitable Growth
Revenue increases, so the founder increases advertising and inventory.
But returns, discounts, product costs, fulfilment, and acquisition expenses may be increasing faster. The company becomes busier without becoming financially stronger.
The Bank Balance Gets Mistaken for Available Cash
A company may have $275,000 in its bank account while owing:
- $90,000 to suppliers
- $52,000 on credit cards
- $38,000 in tax
- $65,000 for upcoming inventory
- $24,000 for payroll and operating expenses
The money is in the account.
But most of it already has a job.
Strong and Weak Products Get Blended Together
A highly profitable hero product may hide several weak SKUs.
The overall margin still looks acceptable, so the founder continues reordering products that absorb cash without producing enough contribution profit.
Teams Start Working From Different Numbers
Marketing uses platform-attributed revenue.
Operations uses order data.
Accounting uses bank deposits.
The founder uses the Shopify dashboard.
Meetings turn into debates about which number is correct instead of conversations about what the business should do next.
Problems Are Found Too Late
A payout discrepancy, supplier-cost increase, return issue, missing invoice, or unprofitable campaign may continue for months before it becomes obvious in the annual accounts.
Monthly reporting shortens the delay between a problem starting and someone acting on it.
Financing Becomes a Last-Minute Cleanup Project
When a lender, investor, or buyer requests reliable information, the business has to reconstruct months or years of records under pressure.
Regular reporting creates an organized financial history that is already easier to explain.
At the end of the day, management reporting is not about producing more paperwork.
It is about reducing the number of important decisions you have to make on a hunch.
- Also read: “Why Your Online Store Isn’t Making Money”
Ready to Know What Your Numbers Are Actually Telling You?
A useful management package should make your business feel clearer, not more complicated.
After reviewing it, you should know:
- Where profit came from
- Where margin was lost
- How much cash is genuinely available
- Which products and channels deserve more investment
- Which risks are building
- What the next few months may look like
- Which decisions need to be made now
SAL Accounting works with Canadian Shopify, Amazon, and multichannel ecommerce businesses that need more than basic bookkeeping. We bring sales, payouts, fees, returns, inventory, tax, cash, and financial reporting into one clearer view.
If your accountant sends reports but you still cannot explain your profit, available cash, or next move, the reporting is not finished.
Book an ecommerce consultation with SAL Accounting before another margin leak, inventory mistake, or cash gap has time to grow.