If your ecommerce contribution margin has turned negative, each new order may be costing more to generate and fulfil than it leaves behind. For growing Canadian ecommerce brands, the problem usually comes from shipping, fulfilment, payment fees, CAC, or several moving at once.
SAL Accounting works with sellers when sales look healthy but the numbers underneath stop making sense. Keep reading before you scale again, because the next batch of orders could turn a small leak into a much bigger one.
Selling through Shopify? Run an order through the Shopify Fee Calculator to see how much may be coming out before the sale reaches your bottom line.
Quick Takeaways
- A negative contribution margin means an order costs more to sell and fulfil than it leaves behind.
- More sales will not fix the problem when every additional order loses money.
- Check the issue at the order, campaign, and customer level before changing prices or cutting ad spend.
- Shipping subsidies and fulfilment costs can make certain products or markets unprofitable while the rest of the store looks fine.
- Rising CAC can turn a previously profitable order negative even when your product price has not changed.
- Fix the largest confirmed leak first, then monitor contribution per order and customer payback so the problem does not creep back.
When sales, payouts, fees, refunds, and order costs stop lining up cleanly, ecommerce bookkeeping gives you a clearer monthly picture of what is actually happening.
What Does a Negative Contribution Margin Mean?
A negative contribution margin means the variable costs attached to a sale are greater than the revenue left from that sale. Shopify describes contribution margin as the money left from sales after variable expenses, which makes it useful for understanding whether another order is actually contributing anything to the business.
The starting formula is simple:
Contribution margin = Net sales − variable costs
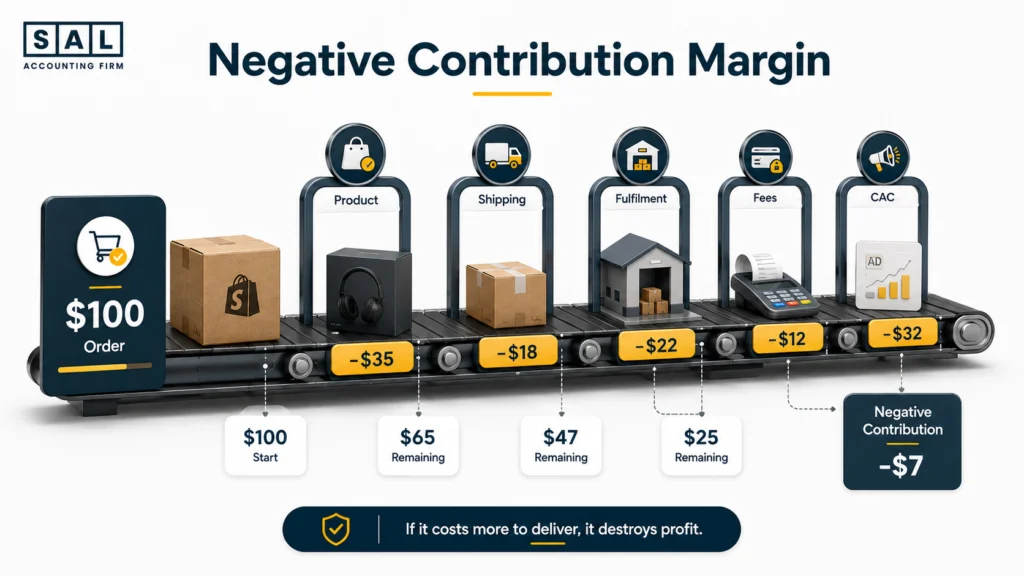
Say an order produces $100 in net sales. Product and packaging cost $31, shipping costs $13, fulfilment costs $8, payment fees are $3, and acquiring the customer costs $48.
That order has $103 of variable costs against $100 of sales. You made the sale, but it left a contribution margin of -$3. For ecommerce, it helps to look at the number in two stages:
- Contribution before acquisition shows what remains after product costs, shipping, fulfilment, payment fees, returns, and other order-level costs.
- Contribution after acquisition adds CAC and shows whether the economics still work once you have paid to bring in the customer.
That distinction tells you where to look. If an order is negative before advertising enters the picture, marketing is probably not the first thing to fix.
Our broader article on ecommerce contribution margin covers the calculation itself. Here, we are starting one step later: the number has already gone negative, so what changed?
What Usually Causes a Negative Contribution Margin?
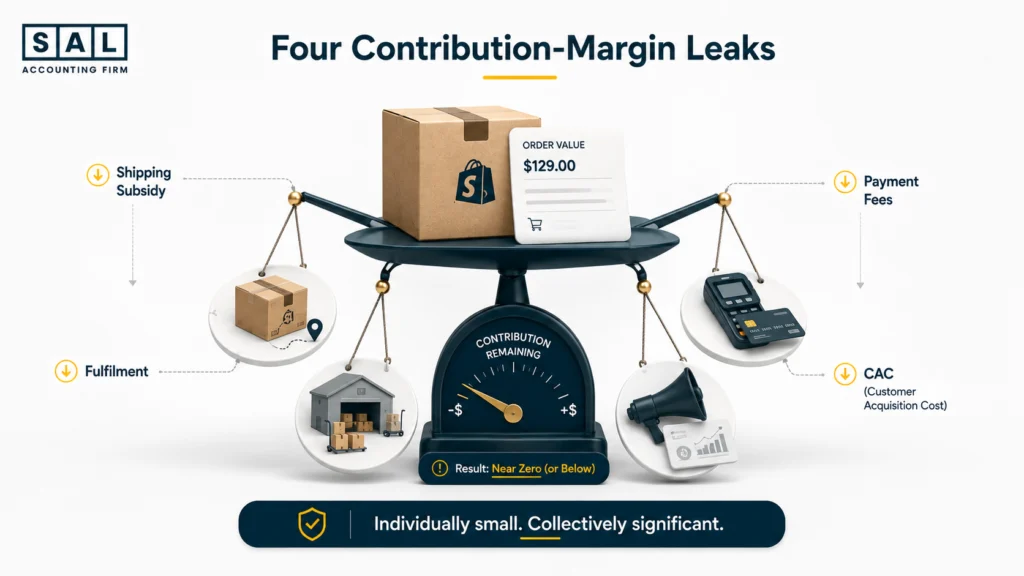
Most negative-margin problems do not come from one dramatic expense. Several normal ecommerce costs usually move in the wrong direction at the same time, which is why hidden ecommerce expenses are easy to miss when you only look at total monthly spending.
Start by comparing each major cost with the last period when your contribution margin still looked healthy.
| Cost Area | Warning Sign | Check First | Likely Issue | First Move |
|---|---|---|---|---|
| Shipping | Cost/order rises | Charge vs actual cost | Too much subsidy | Review threshold |
| Fulfilment | Cost/order jumps | Cost by SKU | Handling/packaging | Split by SKU |
| Payment fees | Fee % rises | Fees ÷ net sales | Payment mix | Verify fees |
| CAC | Ads get pricier | CAC by campaign | Weak acquisition | Review campaigns |
Shipping Subsidy
A shipping subsidy is simply the part of delivery that your business pays instead of the customer.
Say the carrier charges you $17 and the customer pays $5. Your business absorbs the other $12.
That might work on a $160 order. On a $55 order with a thinner product margin, the same subsidy can take a large part of what was supposed to be left behind.
Canadian brands selling into the US should also separate the numbers by market. Cross-border ecommerce shipping can produce very different economics depending on destination, package size, carrier, and fulfilment location.
Shopify currently lets merchants offer flat, carrier-calculated, or free shipping and set conditions based on order value or weight. That means your free-shipping offer does not have to treat every basket the same way.
Pro tip: Compare shipping subsidy per order with the last healthy period. A higher total shipping bill may simply mean more orders. A higher subsidy on each order tells you the economics themselves changed.
Fulfilment Cost
Fulfilment can quietly take a profitable product into negative territory, especially when the headline 3PL rate does not show the whole story.
Look at costs such as:
- pick and pack
- additional-item fees
- packaging
- special handling
- oversized-product charges
- storage on slow-moving inventory
- expensive shipping zones
A blended warehouse invoice may make the whole fulfilment setup look expensive when the real issue is one bulky product or one type of order.
Once the numbers show that the setup itself deserves changing, compare the full order economics rather than the advertised rate. Our breakdown of ecommerce shipping providers gives you a useful starting point.
Payment Fees
Payment fees rarely look alarming one transaction at a time. The problem appears when the effective percentage starts creeping upward across hundreds or thousands of orders.
Shopify notes that payment costs depend on the payment setup, and stores using certain third-party providers can face Shopify transaction fees in addition to fees charged by the payment provider. Shopify Payments transactions can also be exported so merchants can review their fees directly.
That is why hidden Shopify costs should not disappear inside one broad platform-expense category. You need to know which costs are actually moving.
Customer Acquisition Cost
CAC can make a healthy order negative even when nothing changes in the warehouse.
Say an order leaves $34 before acquisition. At a CAC of $22, you still have $12 left. If CAC rises to $41, that same order now leaves -$7.
Your product price may be unchanged. Shipping may be unchanged. The acquisition economics are what broke.
Shopify’s current CAC guidance treats customer acquisition cost as the cost involved in winning a customer, so it should be judged against what those customers actually leave behind rather than revenue alone.
Before making a big budget change, make sure the attribution itself is trustworthy. When Meta Ads, Shopify, and Triple Whale numbers do not match, a campaign can look healthier or worse than it really is.
Case Study: How an Apparel Brand in The Junction, Toronto Finds a $5 Loss on Every New-Customer Order1
An illustrative Shopify apparel brand in The Junction is growing quickly through paid social. Orders are up and its bestseller keeps moving, but cash is not improving at the same pace. A typical new-customer order brings in $92 of net sales against $31 of product and packaging, $15 of shipping subsidy, $9 of fulfilment, $3 of payment fees, and $39 of acquisition cost.
The Problem
The order leaves -$5 after acquisition. Nothing looks disastrous on its own. The real issue is that shipping subsidy and CAC have both increased while the product price and shipping threshold have barely moved.
What We Do
We separate contribution before and after acquisition, then compare shipping subsidy and CAC with the last healthy period. The next tests focus on the free-shipping threshold, product bundles, and campaign-level contribution rather than immediately cutting every ad campaign.
Result
In the worked example, the improved order mix raises net revenue to $116 while relevant variable costs total $103. Contribution moves from -$5 to +$13 per order, and the owner now knows exactly which numbers need watching before increasing ad spend again.
- Also read: “E-commerce Profit Calculation Mistakes to Avoid”
Which Financial Tests Confirm Why Your Margin Turned Negative?
Once you have a few likely causes, run three tests. Each answers a different question, so one blended monthly percentage is not enough.
| Test | Main Question | Level | Red Flag | Points To |
|---|---|---|---|---|
| Order contribution | Does this order work? | Order/SKU | Negative before ads | Product/ops |
| Campaign contribution | Do paid orders work? | Campaign | Ads erase margin | Acquisition |
| Customer payback | Does CAC come back? | Customer | Slow recovery | Growth risk |
Order Contribution Test
Start with a representative order and rebuild it from the top:
Net order revenue
− landed product cost
− shipping subsidy
− variable fulfilment
− payment/platform fees
− return-related variable costs
= contribution before acquisition
Then subtract acquisition cost when you want the post-acquisition result.
The purpose is simple: find where the number first goes below zero. An ecommerce product profitability test follows the same logic at product level.
Your product cost also needs to be reliable before this test means much. Freight, duty, brokerage, and other costs involved in getting inventory ready for sale may change the economics, which is why inventory landed cost accounting deserves attention here.
Campaign Contribution Test
Next, group the relevant orders by campaign. ROAS tells you how much revenue came back relative to advertising spend. Contribution asks what remained after the variable costs of those orders were paid too. For example:
- Campaign net sales: $40,000
- Contribution before acquisition: $12,500
- Advertising spend: $14,000
- Campaign contribution: -$1,500
That campaign generated plenty of revenue. It still did not create positive contribution.
This gives you a much better answer to “Should we scale this?” than revenue alone.
Customer Payback Test
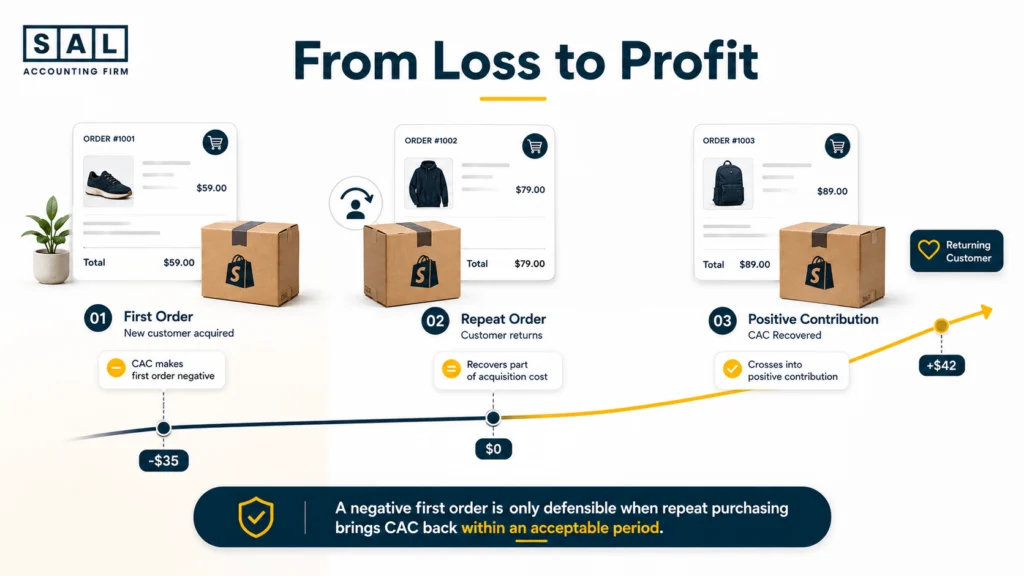
A negative first order is not automatically a bad order. Some ecommerce brands deliberately spend more upfront because repeat orders recover that acquisition cost later.
The important word is later.
Shopify defines CAC payback period as the amount of time needed to recover the cost of acquiring a new customer. The longer that period becomes, the longer cash stays tied up before the acquisition spend comes back.
Ask yourself:
- What does the first order contribute?
- What percentage of customers actually reorder?
- How soon does the second purchase happen?
- How much contribution does that repeat order create?
- When is the original CAC fully recovered?
Pro tip: Do not justify a negative first order with a large lifetime-value estimate unless your actual customer cohorts show that buyers really come back and tell you when that value arrives.
What You’ll Need to Pull to Check This
You do not need a giant finance project. You need enough information to follow an order from checkout to what the business actually keeps.
From your store
Pull:
- net sales
- discounts and refunds
- order and SKU data
- customer shipping charges
- product costs
- new versus returning customer data
Shopify’s current profit reports can include product charges, shipping charges, duties, product costs, and store-side shipping costs, including market and order-level views. Its finance reports cover areas such as product sales and payments.
When those Shopify reports still do not line up properly with the books, Shopify accounting services give you a clearer view of the sales, payouts, fees, refunds, and costs behind the store.
From operations
Pull:
- supplier invoices
- freight and brokerage records
- carrier costs
- fulfilment invoices
- packaging costs
- return and chargeback records
Your ecommerce bookkeeping checklist is a useful cross-check when these records are sitting across too many platforms or folders.
From marketing and payments
Pull your payment-processor fees plus Meta, Google, or other acquisition spend. Then keep the customer and campaign data close enough to the order data that you can compare them properly.
Amazon-heavy stores need a slightly different trail because settlements can include fees, refunds, adjustments, reserves, and other activity before cash reaches the bank. Bookkeeping for Amazon sellers is built around that settlement-level detail.
Want the records in one place before you start? Organize them with the Tax Document Checklist for Ecommerce Stores.
Read more: “Shopify Order Financial Lifecycle: Sale to Bank Deposit”
Is This a One-Off, or Is It Happening on Every Order?
Once you confirm the problem, find the smallest level where it consistently appears.
Break contribution down by:
- SKU or product family
- campaign or channel
- Canada versus US
- shipping zone
- new versus returning customer
- discount or promotion
- fulfilment method
Suppose the overall store contribution margin is -2%. That sounds like the entire business has a problem.
Then you split the numbers and discover most products are still positive. One bestseller is deeply negative because it costs more to ship and requires much more ad spend.
That is a product-level problem, not automatically a store-level problem.
Shopify currently provides market-level profit reporting that can be drilled into individual orders, which is useful when Canadian and US orders behave differently. A deeper ecommerce SKU profitability analysis becomes useful when the problem follows particular products.
Pro tip: Start with the smallest repeatable pattern. One SKU, one campaign, or one market is much easier to fix than treating the whole store as broken.
What Does a Negative Contribution Margin Cost You If You Leave It?
Negative contribution becomes more dangerous when higher sales volume hides the problem. Orders may be climbing while cash gets tighter because every new sale is repeating the same loss.
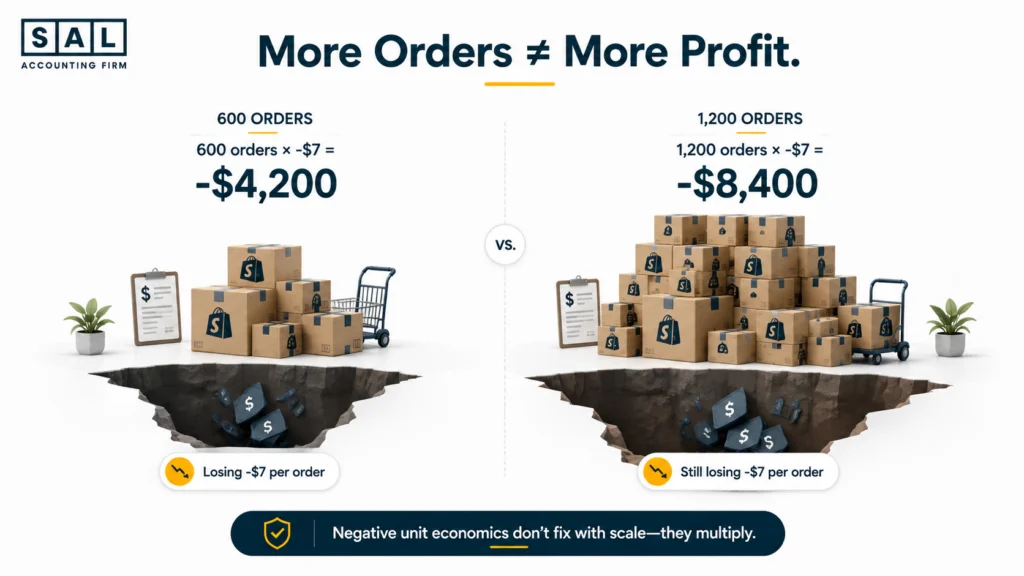
For example, if the average new-customer order loses $7:
- 600 orders a month = $4,200 of negative contribution
- 1,200 orders a month = $8,400 of negative contribution
And that is before salaries, software, accounting, and other fixed costs enter the picture.
This is one reason ecommerce profit and cash flow can look disconnected. More sales can mean more inventory purchases, shipping, fulfilment, and acquisition spend without necessarily leaving more money behind.
The point is, growth does not fix weak unit economics. It puts more volume through them.
- Also read: “Why Your Online Store Isn’t Making Money: 7 Fixes”
Corrective Actions: What Should You Fix First?
Do not start by cutting whichever expense annoys you most. Start with the largest confirmed leak.
A practical order is:
- Find the product, campaign, market, or order type that is negative.
- Compare it with the last healthy period.
- Identify which variable cost moved the most.
- Slow aggressive scaling in that area.
- Fix the main driver.
- Recalculate contribution before scaling again.
That keeps the fix tied to the problem instead of turning margin improvement into random cost cutting.
Raise the Shipping Threshold
If shipping subsidy is the problem, test the free-shipping threshold before removing free shipping completely.
Say your average order is $71 and free shipping starts at $75. A customer only needs another $4 to qualify while the business may be absorbing $14 or $16 of delivery cost.
Before changing the threshold, look at:
- average and median order value
- shipping cost per order
- product margin
- items per order
- weight and dimensions
- customer location
Shopify’s shipping setup supports price-based conditions, so this is something you can test rather than treating free shipping as an all-or-nothing decision.
Change the Fulfilment Setup
When fulfilment is the confirmed leak, find the expensive part before replacing the whole operation.
The cause may be one oversized SKU, too much packaging, extra handling, an expensive shipping zone, or slow stock creating storage costs.
Run a few representative orders through the current setup and the alternative. Compare the complete variable cost per order, not just the advertised pick-and-pack rate.
Case Study: How a Home-Organization Brand in Streetsville, Mississauga Finds Its Fulfilment Leak2
An illustrative home-organization brand in Streetsville sells bulky storage products across Canada and is getting more US orders. Revenue looks healthy, but several bestselling products are leaving surprisingly little behind. A typical $128 order carries $47 of product cost, $20 of shipping, $22 of fulfilment and handling, $4 of payment fees, and $40 of acquisition cost.
The Problem
The order leaves -$5. CAC could be better, but the bigger clue is fulfilment: oversized packaging and extra handling have pushed shipping plus fulfilment to $42 on the order.
What We Do
We separate the costs by SKU and shipping zone instead of relying on the blended warehouse average. Packaging, handling rules, fulfilment pricing, and Canadian versus US delivery costs are compared before assuming the whole 3PL relationship needs replacing.
Result
In the worked example, better packaging and fulfilment economics reduce the combined cost from $42 to $30. The same $128 order moves from -$5 to +$7 without depending on a major price increase or a dramatic advertising cut.
Reduce Customer Acquisition Cost
When contribution is healthy before acquisition but goes negative after CAC, focus on the acquisition side.
Split CAC by:
- campaign
- creative
- product
- offer
- landing page
- country
- new versus returning customer
Do not cut every campaign because blended CAC went up. One campaign may still produce healthy contribution while another is buying expensive revenue.
Reducing CAC does not always mean spending less either. Better conversion, stronger offers, better product mix, and reallocating spend toward healthier campaigns can all change what a customer costs to acquire.
Pro tip: Give major campaigns a contribution target alongside ROAS. That keeps the marketing decision tied to what the orders actually leave behind.
Ongoing Monitoring: How Do You Stop It From Creeping Back?
Once the immediate problem is fixed, keep the monitoring small enough that somebody will actually use it.
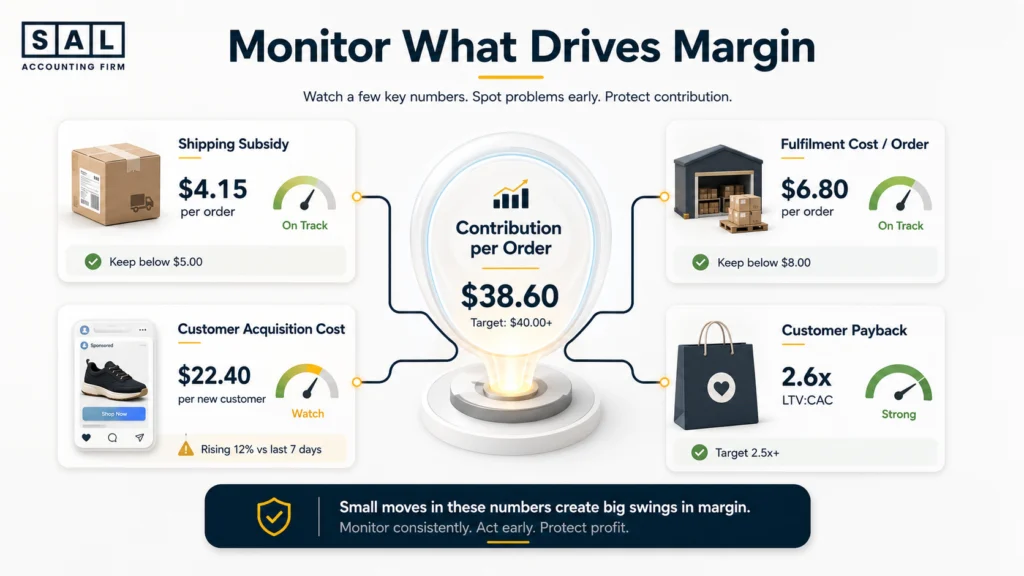
| Metric | Review | Warning Sign | Best Split | Decision |
|---|---|---|---|---|
| Contribution/order | Weekly | Steady decline | SKU/channel | What to scale |
| Shipping subsidy | Weekly | Cost/order rises | Market/SKU | Shipping offer |
| Fulfilment/order | Monthly | Sudden jump | SKU/3PL | Ops change |
| CAC | Weekly | Outruns contribution | Campaign | Ad budget |
| Payback | Monthly | Recovery slows | Cohort | Growth pace |
Contribution per Order
Store-wide contribution tells you something is wrong. Contribution per order makes the problem easier to locate.
Focus on the areas responsible for most of the business:
- top products
- biggest campaigns
- main markets
- new customers
- repeat customers
Good ecommerce management reporting should turn those numbers into decisions about products, inventory, costs, and advertising instead of creating another dashboard nobody acts on.
The figures also need to tie back to real sales and cash activity. Regular ecommerce reconciliation keeps sales, refunds, processors, payouts, fees, and bank deposits from drifting apart over time.
Payback Period
Payback matters most when paid acquisition drives a large share of growth.
A -$10 first order may be workable when repeat customers reliably generate another $30 of contribution shortly afterwards. The same -$10 means something very different when customers rarely buy again.
Track how long acquisition cash stays out of the business rather than looking only at a lifetime-value estimate. Shopify’s updated CAC payback guidance makes the same core point: the metric is about how long it takes to recover the acquisition cost.
Ready to Fix This Before It Spreads to More Orders?
A negative contribution margin does not automatically mean your whole store is failing. It means something inside the order economics has moved far enough that more volume may now be working against you.
Find the smallest place where the loss repeats, fix the largest confirmed cause, and run the numbers again before pushing harder on growth. For the bigger picture beyond one margin problem, SAL’s Financial Growth Blueprint gives Canadian Shopify brands a practical roadmap for what to check next.